Bitcoin
Checking source
7d: loading…
Waiting for source
Loading history…
Latest available observations
Checking source
7d: loading…
Waiting for source
Loading…
Checking source
7d: loading…
Waiting for source
Loading…
Checking source
YTD: loading…
Checking latest decision…
Waiting for source
Loading…
12-month window · observed target bounds. Steps use New York Fed observation dates; long data gaps stay visible.
Checking year-end baseline…
Checking next scheduled decision…
Checking source
7d: loading…
Waiting for source
Loading…
Checking source
7d: loading…
Waiting for source
Loading…
Checking source
7d: loading…
Waiting for source
Loading…
Checking source
Net flows: loading…
Waiting for source
Loading…
Checking source
Calendar: loading…
Waiting for source
Loading…
Latest BTC/USD trade on Coinbase Exchange, with the trade timestamp. This is an exchange price, not a blended global quote. The approximate seven-day return uses Coinbase’s last complete one-minute candle at or before the equivalent time seven days earlier. Current price remains available if history is missing.
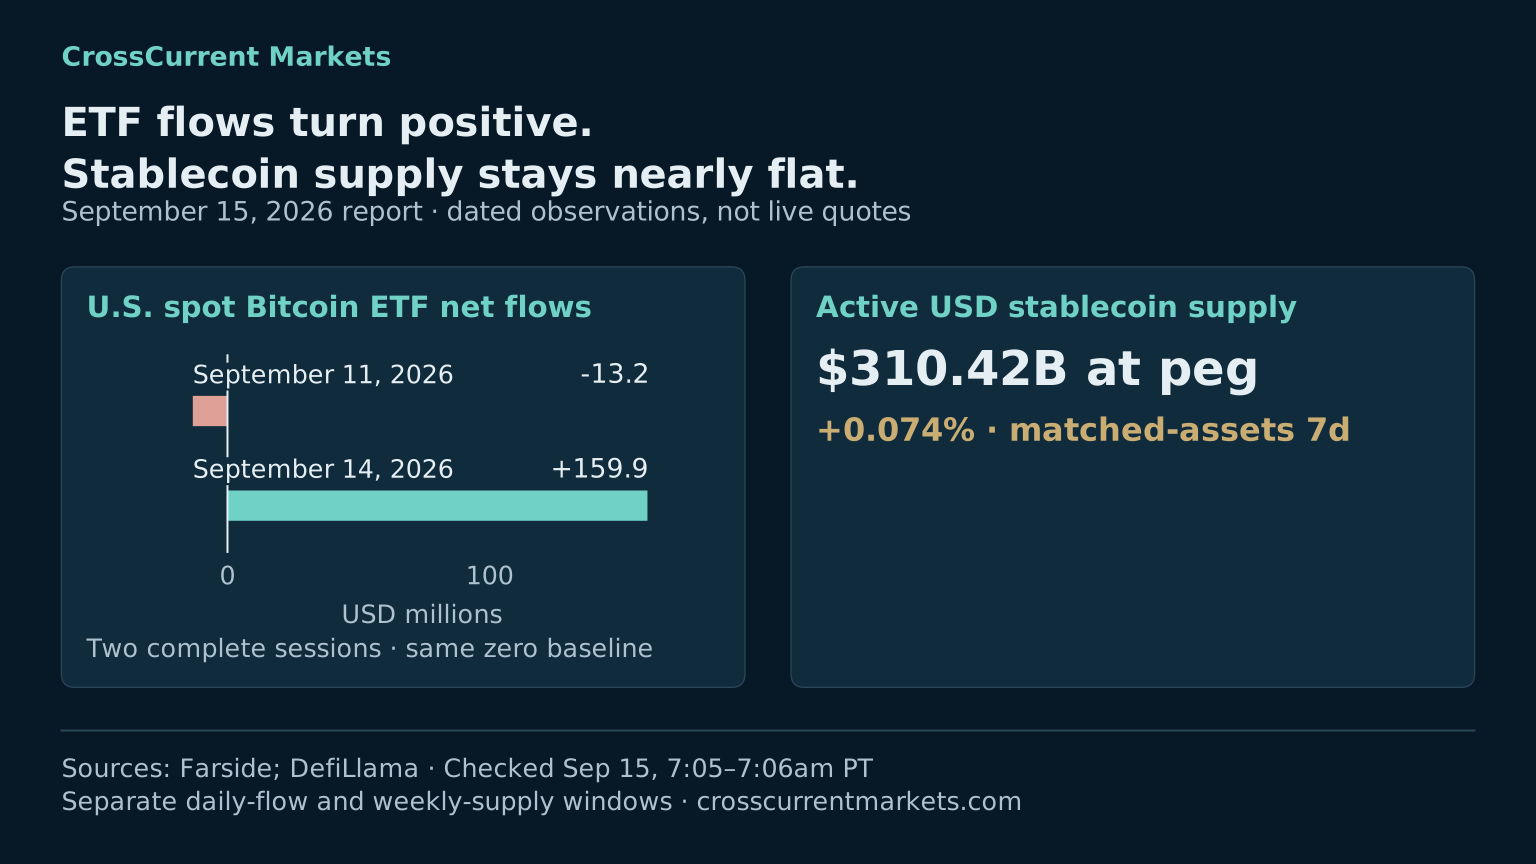
Current circulating units of active USD-pegged assets, valued at their $1 peg. Excludes assets marked dead, delisted or deprecated by the provider. This is aggregate supply, not an individual coin price or cash ready to buy BTC. Weekly change compares the same assets in both periods; when history is missing, the label says matched assets. The current total still includes those newer assets. Data follows the provider’s update schedule.
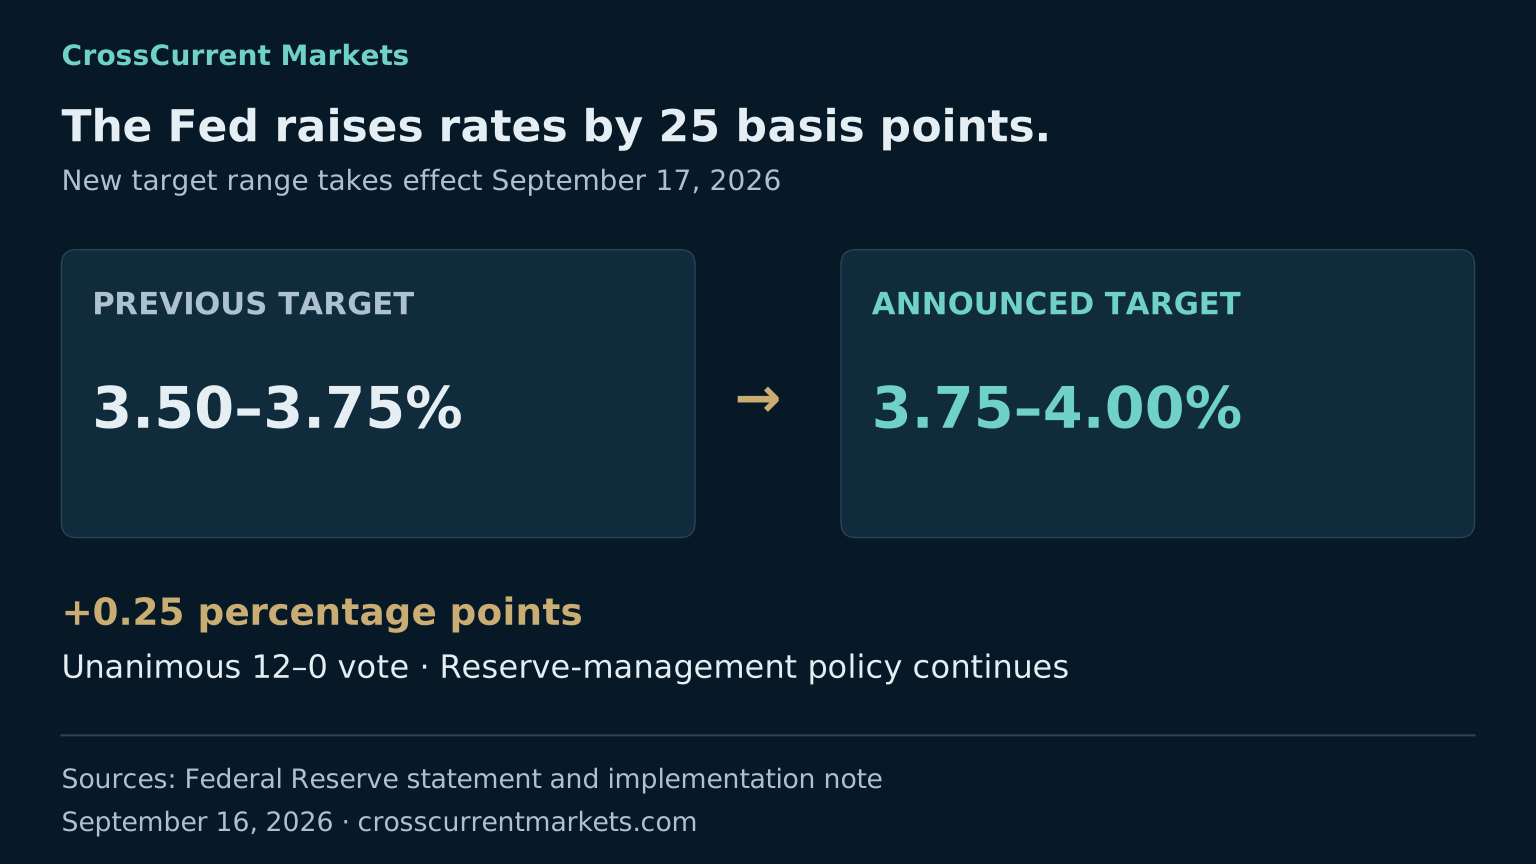
Current target bounds and the previous year-end baseline come from the New York Fed. Net change YTD compares both bounds in basis points. The latest decision comes from the official FOMC statement, and the next scheduled announcement from the Fed calendar. A newer announcement can lead the daily effective-rate observation. Schedule times use the regular 2pm Eastern convention, displayed in Pacific Time; a passed meeting is never assumed to be a hold.
Cash at the Fed is one piece of the liquidity picture.
Bitcoin’s share of CoinLore’s tracked crypto market capitalization. Provider coverage can differ; this is not a measure of cash inflows.
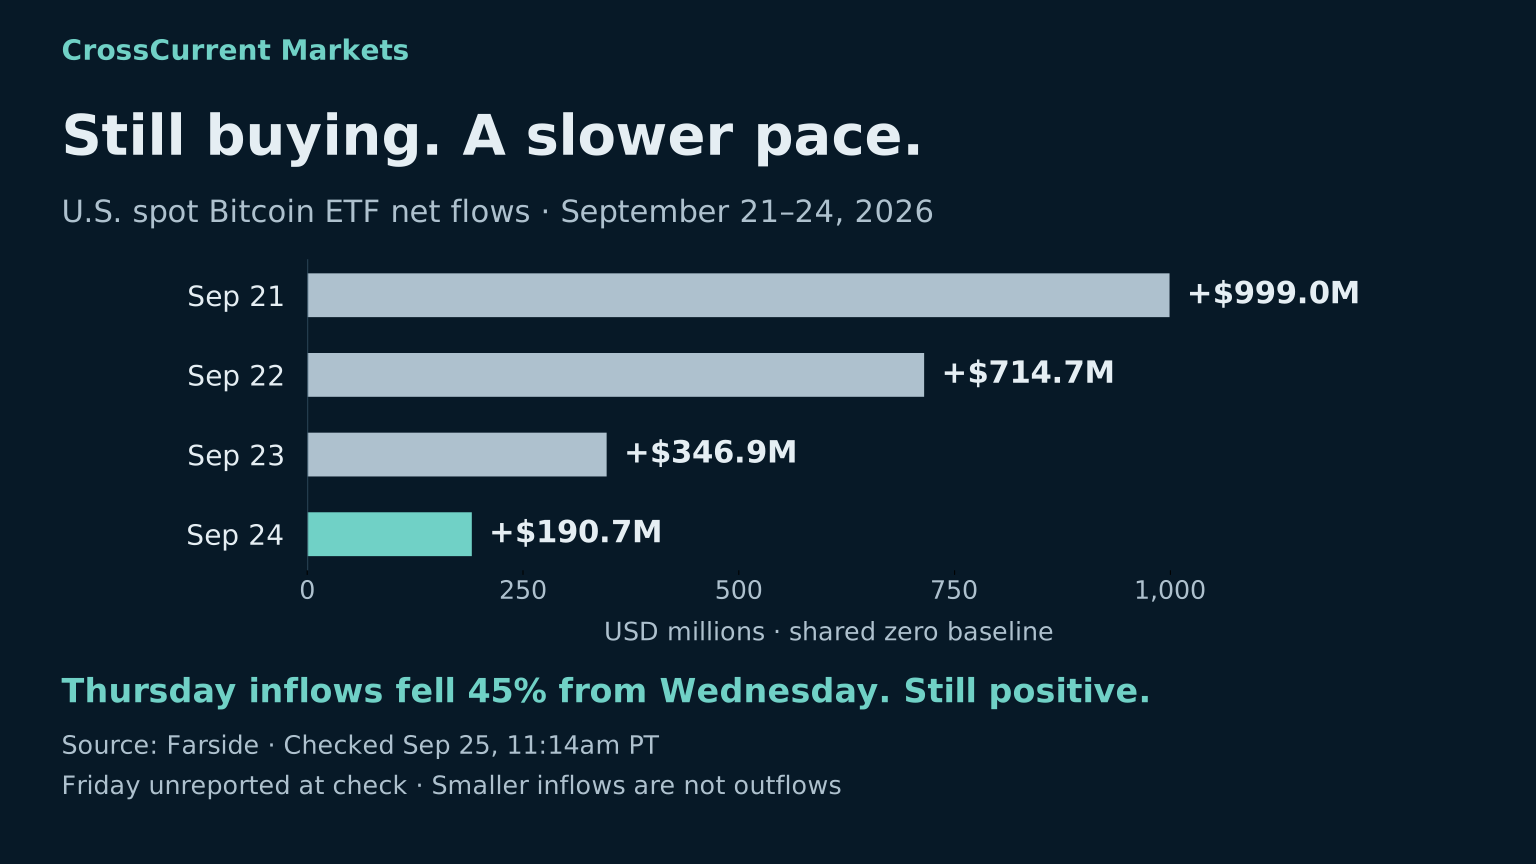
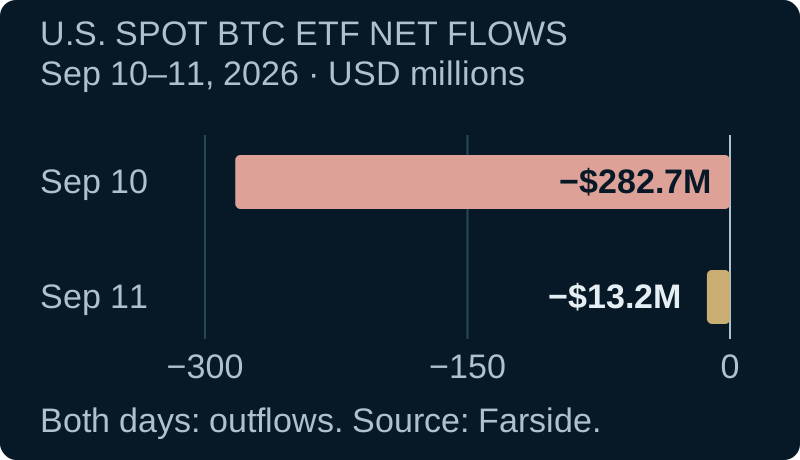
Daily net flows for 12 tracked U.S. spot Bitcoin funds. The headline uses the latest date when every tracked fund has reported; a pending day is never treated as zero. The seven-day net sums complete trading days in the seven calendar days ending on that date. Positive means net inflows; negative means net outflows. These flows do not identify investor types. Figures are provisional. XOOMAR flagged its dataset for review on September 14, 2026; our initial complete daily totals were cross-checked against Farside.
Next listed event among selected major U.S. releases: Fed decisions, consumer prices, jobs, GDP, PCE, retail sales and jobless claims. Event instants are shown in Pacific Time, including daylight saving. The countdown advances to the next listed event after its scheduled time; this does not confirm publication. The calendar can be revised and does not cover every global event.
ETF references: Farside daily table · NYSE holiday calendar. Macro calendars: Federal Reserve · BLS · BEA · Census · Labor Department.
Timestamps use Pacific Time; source observation dates stay on their original calendar date. Every page load and return from the background requests fresh data. BTC also refreshes every minute while this page is open; other sources are checked every 30 minutes. BTC and stablecoin requests bypass browser response caches. Provider updates can still lag. BTC shows its trade time; stablecoin supply and dominance show when the provider was checked. Other dates belong to the published observations. Weekly changes use percent for BTC, stablecoins and reverse repo; SOFR uses basis points (100 bp = 1 percentage point). The Fed target tile instead shows net change since the previous year-end, with the latest policy decision and 12-month history under Details. A holiday comparison shows its actual baseline date. BTC dominance history is not available from this feed. ETF flows show a daily net amount and a seven-day net total in USD, not a percentage return. The macro tile is a schedule, so percentage change does not apply. Publication schedules vary. Stablecoin supply counts USD-pegged circulating units at peg. BTC charts use complete hourly closes and leave missing intervals unconnected. ETF bars show complete daily net flows; missing sessions are not zero. Stablecoin bars compare the matched basket now and seven days earlier, not daily history; the headline includes all active assets. Figures are public observations, not CrossCurrent model signals or forecasts.