
Historical report · observations from September 15, 2026
The distinction ETF flows measure one investment channel; BTC prices reflect the wider market.
Read the clocks A completed fund session differs from a rolling 24-hour return.
Seek confirmation Check complete reporting, subsequent flows and financing conditions.
Read the full analysis and sources
Positive Bitcoin ETF flows and a falling Bitcoin price can coexist. ETF flows describe one investment channel over a reporting period. Bitcoin's price reflects trading across the wider market, often measured over a different period.
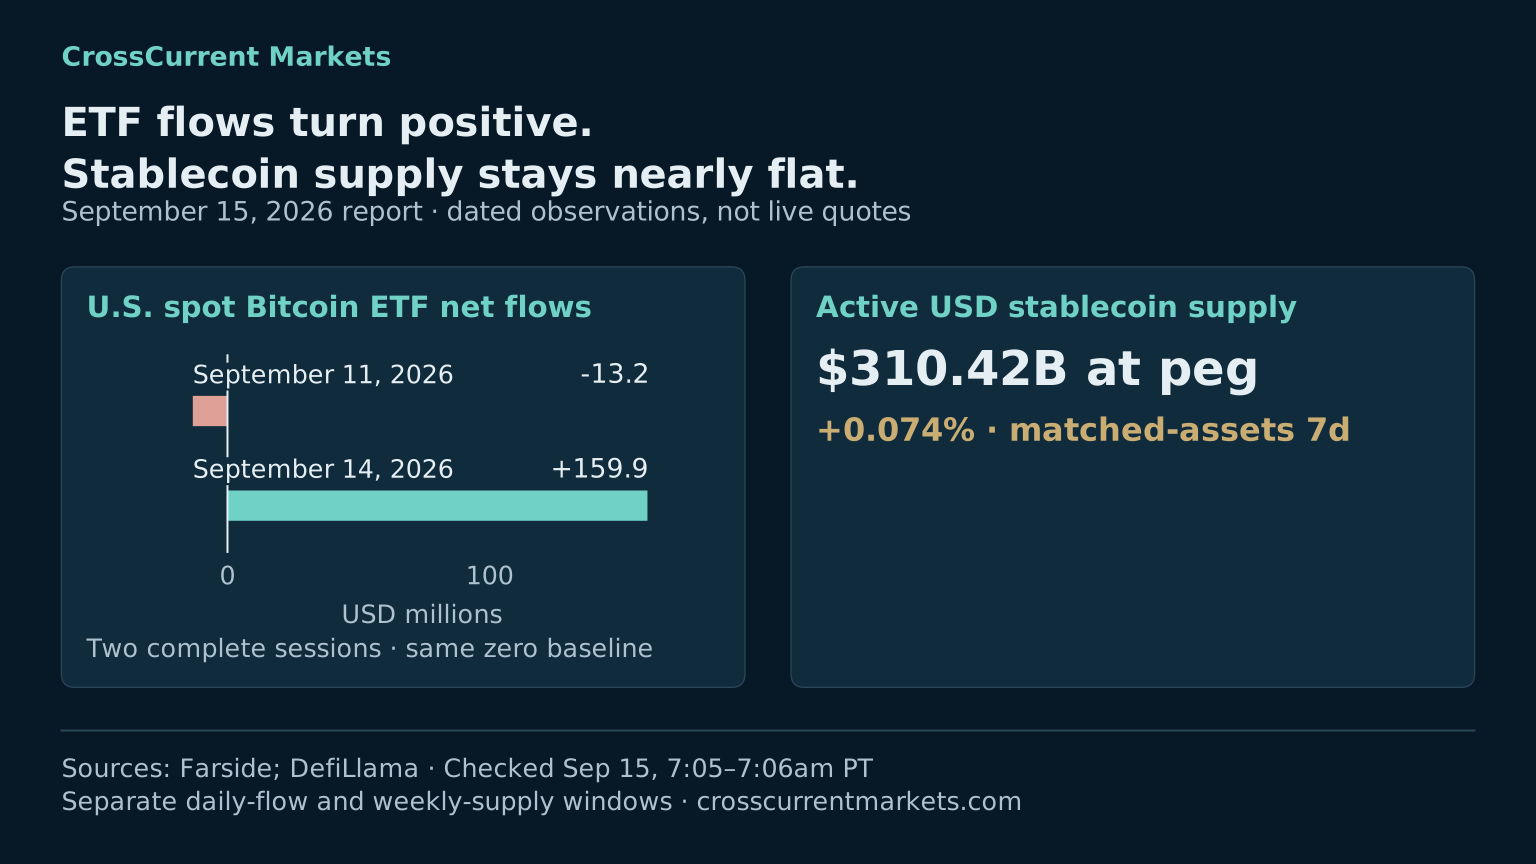
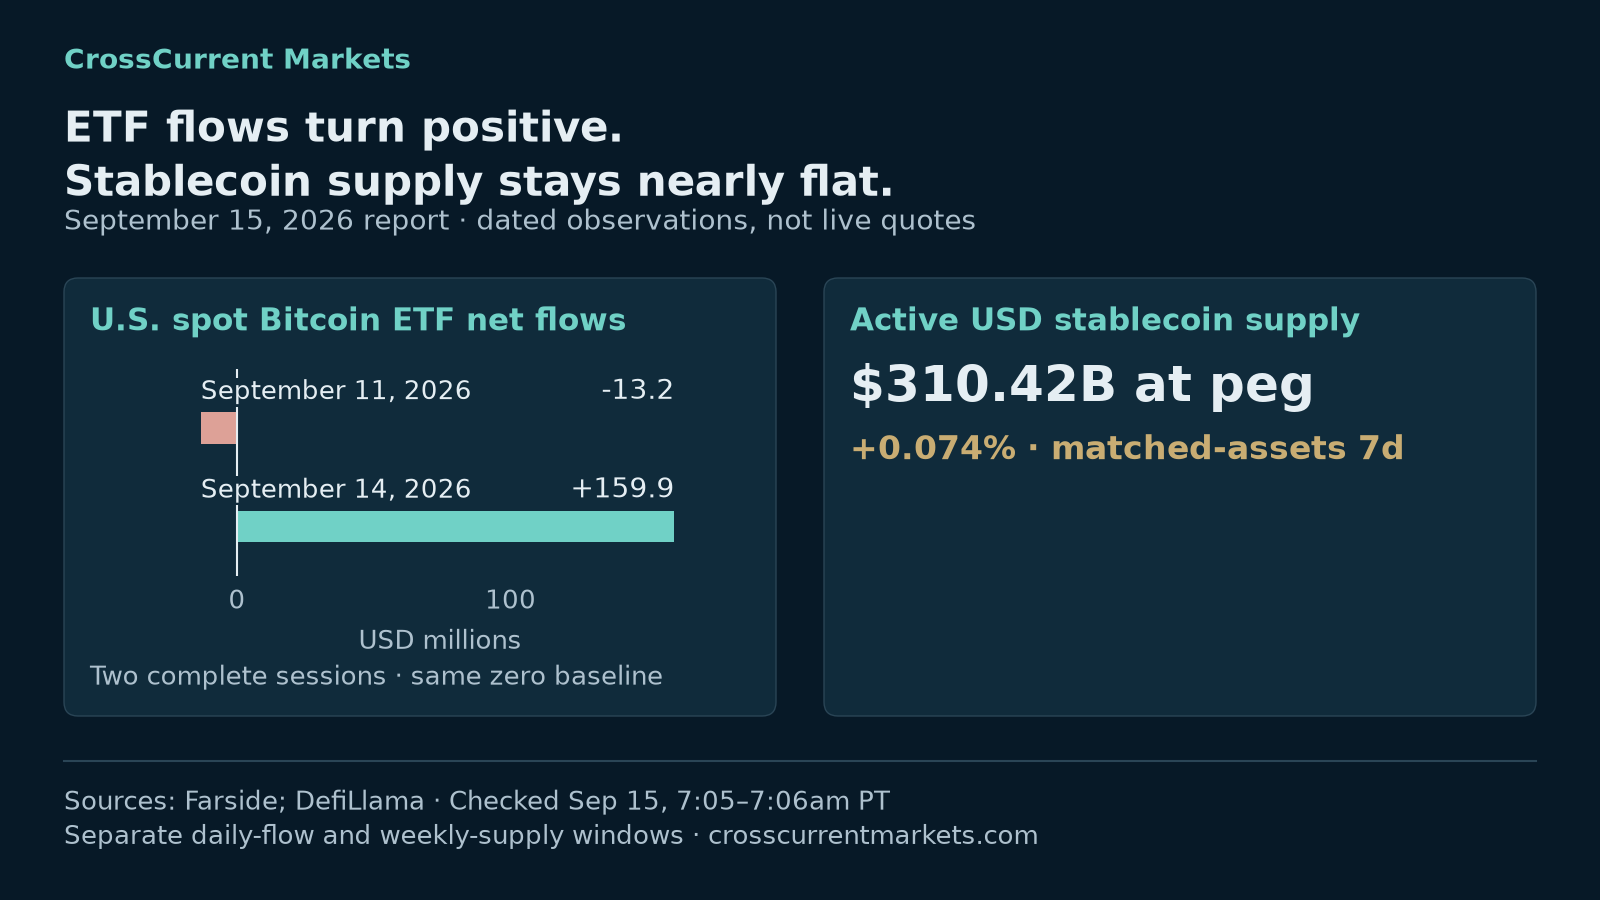
The September 15 morning check illustrates the distinction: U.S. spot Bitcoin ETFs recorded a $159.9 million net inflow for September 14, while Coinbase's BTC quote was down 2.70% over its rolling 24 hours when checked at 7:05 a.m. Pacific. Both observations can be correct. Neither, by itself, tells us what caused the other. Farside, Coinbase.
First, align the clocks
An ETF session total and a rolling crypto return answer different questions. The session total refers to a completed reporting day for a defined set of funds. A rolling 24-hour return changes its start and end points whenever the quote is refreshed.
In this example, September 14's ETF flow is being compared with a Tuesday morning price observation. The windows overlap imperfectly. That makes the pair useful context, but a weak basis for assigning cause and effect to a particular move.
Before comparing the two, record the ETF session date, the price source, the quote's check time and the price-return window. A stronger investigation would align trading periods and study more observations. This two-observation example is not a statistical estimate of ETF price impact.
Fund flows are not the whole market
ETF shares can trade between investors, while creation and redemption mechanisms change the number of shares outstanding. Ordinary secondary-market trading volume and net fund flow are different concepts. Product structure also matters: a general ETF description should not be assumed to describe every operational detail of every spot Bitcoin product. SEC investor bulletin.
Reported net inflows can therefore show improved demand through the tracked funds without measuring every source of buying and selling across spot markets, derivatives and other holders. The price is set through trading at the margin, not by adding one fund-flow total to market capitalization.
It is possible for fund demand to improve while selling elsewhere, hedging or changed expectations affects prices. Those are possible explanations to investigate. The September 15 snapshot does not identify which participants acted, prove a particular mechanism or quantify how much lower the price would have been without the inflows.
Complete reporting comes before interpretation
For September 14, all 12 fund entries in Farside's table were populated. The $159.9 million total followed September 11's $13.2 million outflow. That is a change in the sign of reported net flows across two completed sessions. Farside's table.
September 15 was still unreported during the morning check. Missing fund entries do not become zero because a table displays a zero total. Likewise, a partial dataset that happens to match another source's sum does not establish full coverage. We require complete session coverage before interpreting a daily total, and retain the possibility of compiler revisions.
One positive session is evidence of that session's demand. A sustained-flow argument needs subsequent complete observations. It also benefits from examining which funds contributed and whether the pattern persists across changing market conditions.
Stablecoin supply adds another perspective
The same morning's active USD stablecoin supply was $310.42 billion at peg, with a matched-assets seven-day increase of 0.074%. This comparison was nearly flat. It measured circulating supply, not money already committed to Bitcoin. DefiLlama.
The weekly calculation compared 307 assets with balances in both periods, covering 99.986% of current supply. The full current total included 312 active assets. Comparing the same assets reduces distortions from missing prior balances; it does not remove every limitation in a provider's coverage or timing.
Daily ETF flows and weekly stablecoin supply changes should stay separate. They differ in units, economic meaning and measurement window. A panel beside another panel provides context, not permission to add the numbers into an aggregate “Bitcoin liquidity” figure. Our ETF and stablecoin guide explains that distinction further.
Look for confirmation and counterevidence
In the September 15 report, options-implied volatility was higher than one day earlier. Dated Treasury-yield and broad-dollar observations also offered a potential counterweight to stronger fund demand. Credit spreads, however, were narrower in the latest available observation. These mixed readings are a reason to preserve uncertainty. Read the full daily report.
The next research step is to examine subsequent complete ETF sessions alongside financing conditions and actual Bitcoin price behavior. Further inflows and easier conditions would support the demand interpretation. Renewed outflows or tighter conditions would weaken it. A single price move does not settle the question.
A practical reading checklist
- Confirm the fund universe and that every required entry has reported.
- Keep trading volume, net fund flows, market capitalization and stablecoin supply distinct.
- Align observation windows before comparing magnitudes or calculating relationships.
- Look for evidence outside the ETF channel, including contrary evidence.
- Describe possible mechanisms as possibilities until the data establish them.
- Preserve the original dated assessment when later observations arrive.
The example uses a frozen September 15 morning snapshot, not live prices. CrossCurrent's interpretation is informational research, not a forecast or a personalized instruction to buy or sell.
Archived report · September 15, 2026. Values retain their original dates.