
Historical report · observations from September 14, 2026
Read the full analysis and sources
Bitcoin can rise while spot ETF investors withdraw money and stablecoin supply barely changes. That combination is possible because the measures describe different parts of the market. A price is a trading outcome, a fund flow concerns a particular investment vehicle, and stablecoin supply is a balance outstanding.
Our September 14 report provides a practical example. U.S. BTC ETF outflows had slowed, and active USD stablecoin supply was nearly flat over the week. Our interpretation was limited confirmation for a broader demand improvement. The purpose of this article is to show what each observation adds, where the comparison stops, and how a subsequent update could change that interpretation.
Begin with the question each number answers
| Measure | Question it helps answer | What it cannot establish alone |
|---|---|---|
| BTC price and return | At what price did BTC trade, and how did that price change over a defined window? | The funding source or motivation of buyers. |
| Net spot ETF flow | What net flow did the selected provider report for the included funds and session? | All BTC demand, every investor's identity, or a guaranteed subsequent price move. |
| Active USD stablecoin supply | How much circulating supply exists within the selected USD-pegged asset set? | How much will be spent on BTC, or whether all tokens can be redeemed at par. |
Keeping these questions separate avoids adding unlike numbers into an apparently precise liquidity total. Our framework combines interpretations, not incompatible units.
ETF share trading and fund flows are different
The SEC's investor bulletin distinguishes exchange trading in existing ETF shares from the creation and redemption of shares through a fund's authorized participants. This general distinction is useful when interpreting a reported flow: turnover in shares is not itself the same as a net addition to the fund. Product-specific arrangements still require the fund's own documentation. SEC ETF investor bulletin.
For a Bitcoin product, issuer disclosures should identify its objective and holdings. For example, the iShares Bitcoin Trust ETF describes its purpose as providing exposure to Bitcoin's price. A holdings page, however, does not identify the intentions of every person trading its shares. iShares Bitcoin Trust ETF.
We therefore keep the language specific: “reported U.S. BTC ETF net flows,” with the provider and session stated. Calling the same number “all institutional buying” would assert more than the measure establishes.
A smaller outflow is still an outflow
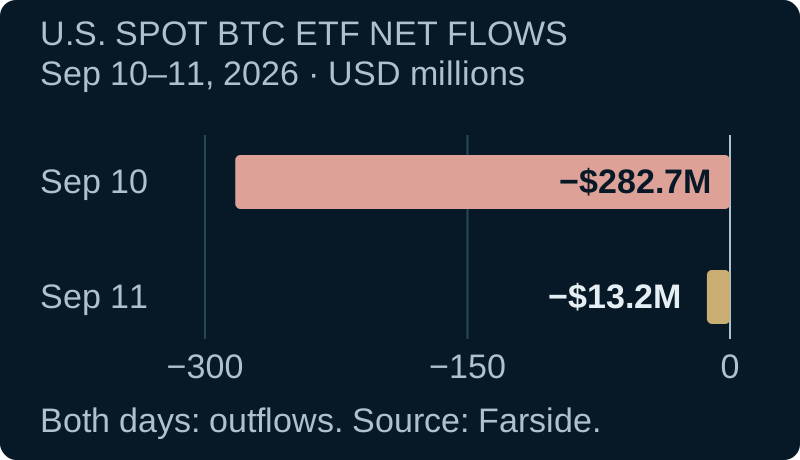
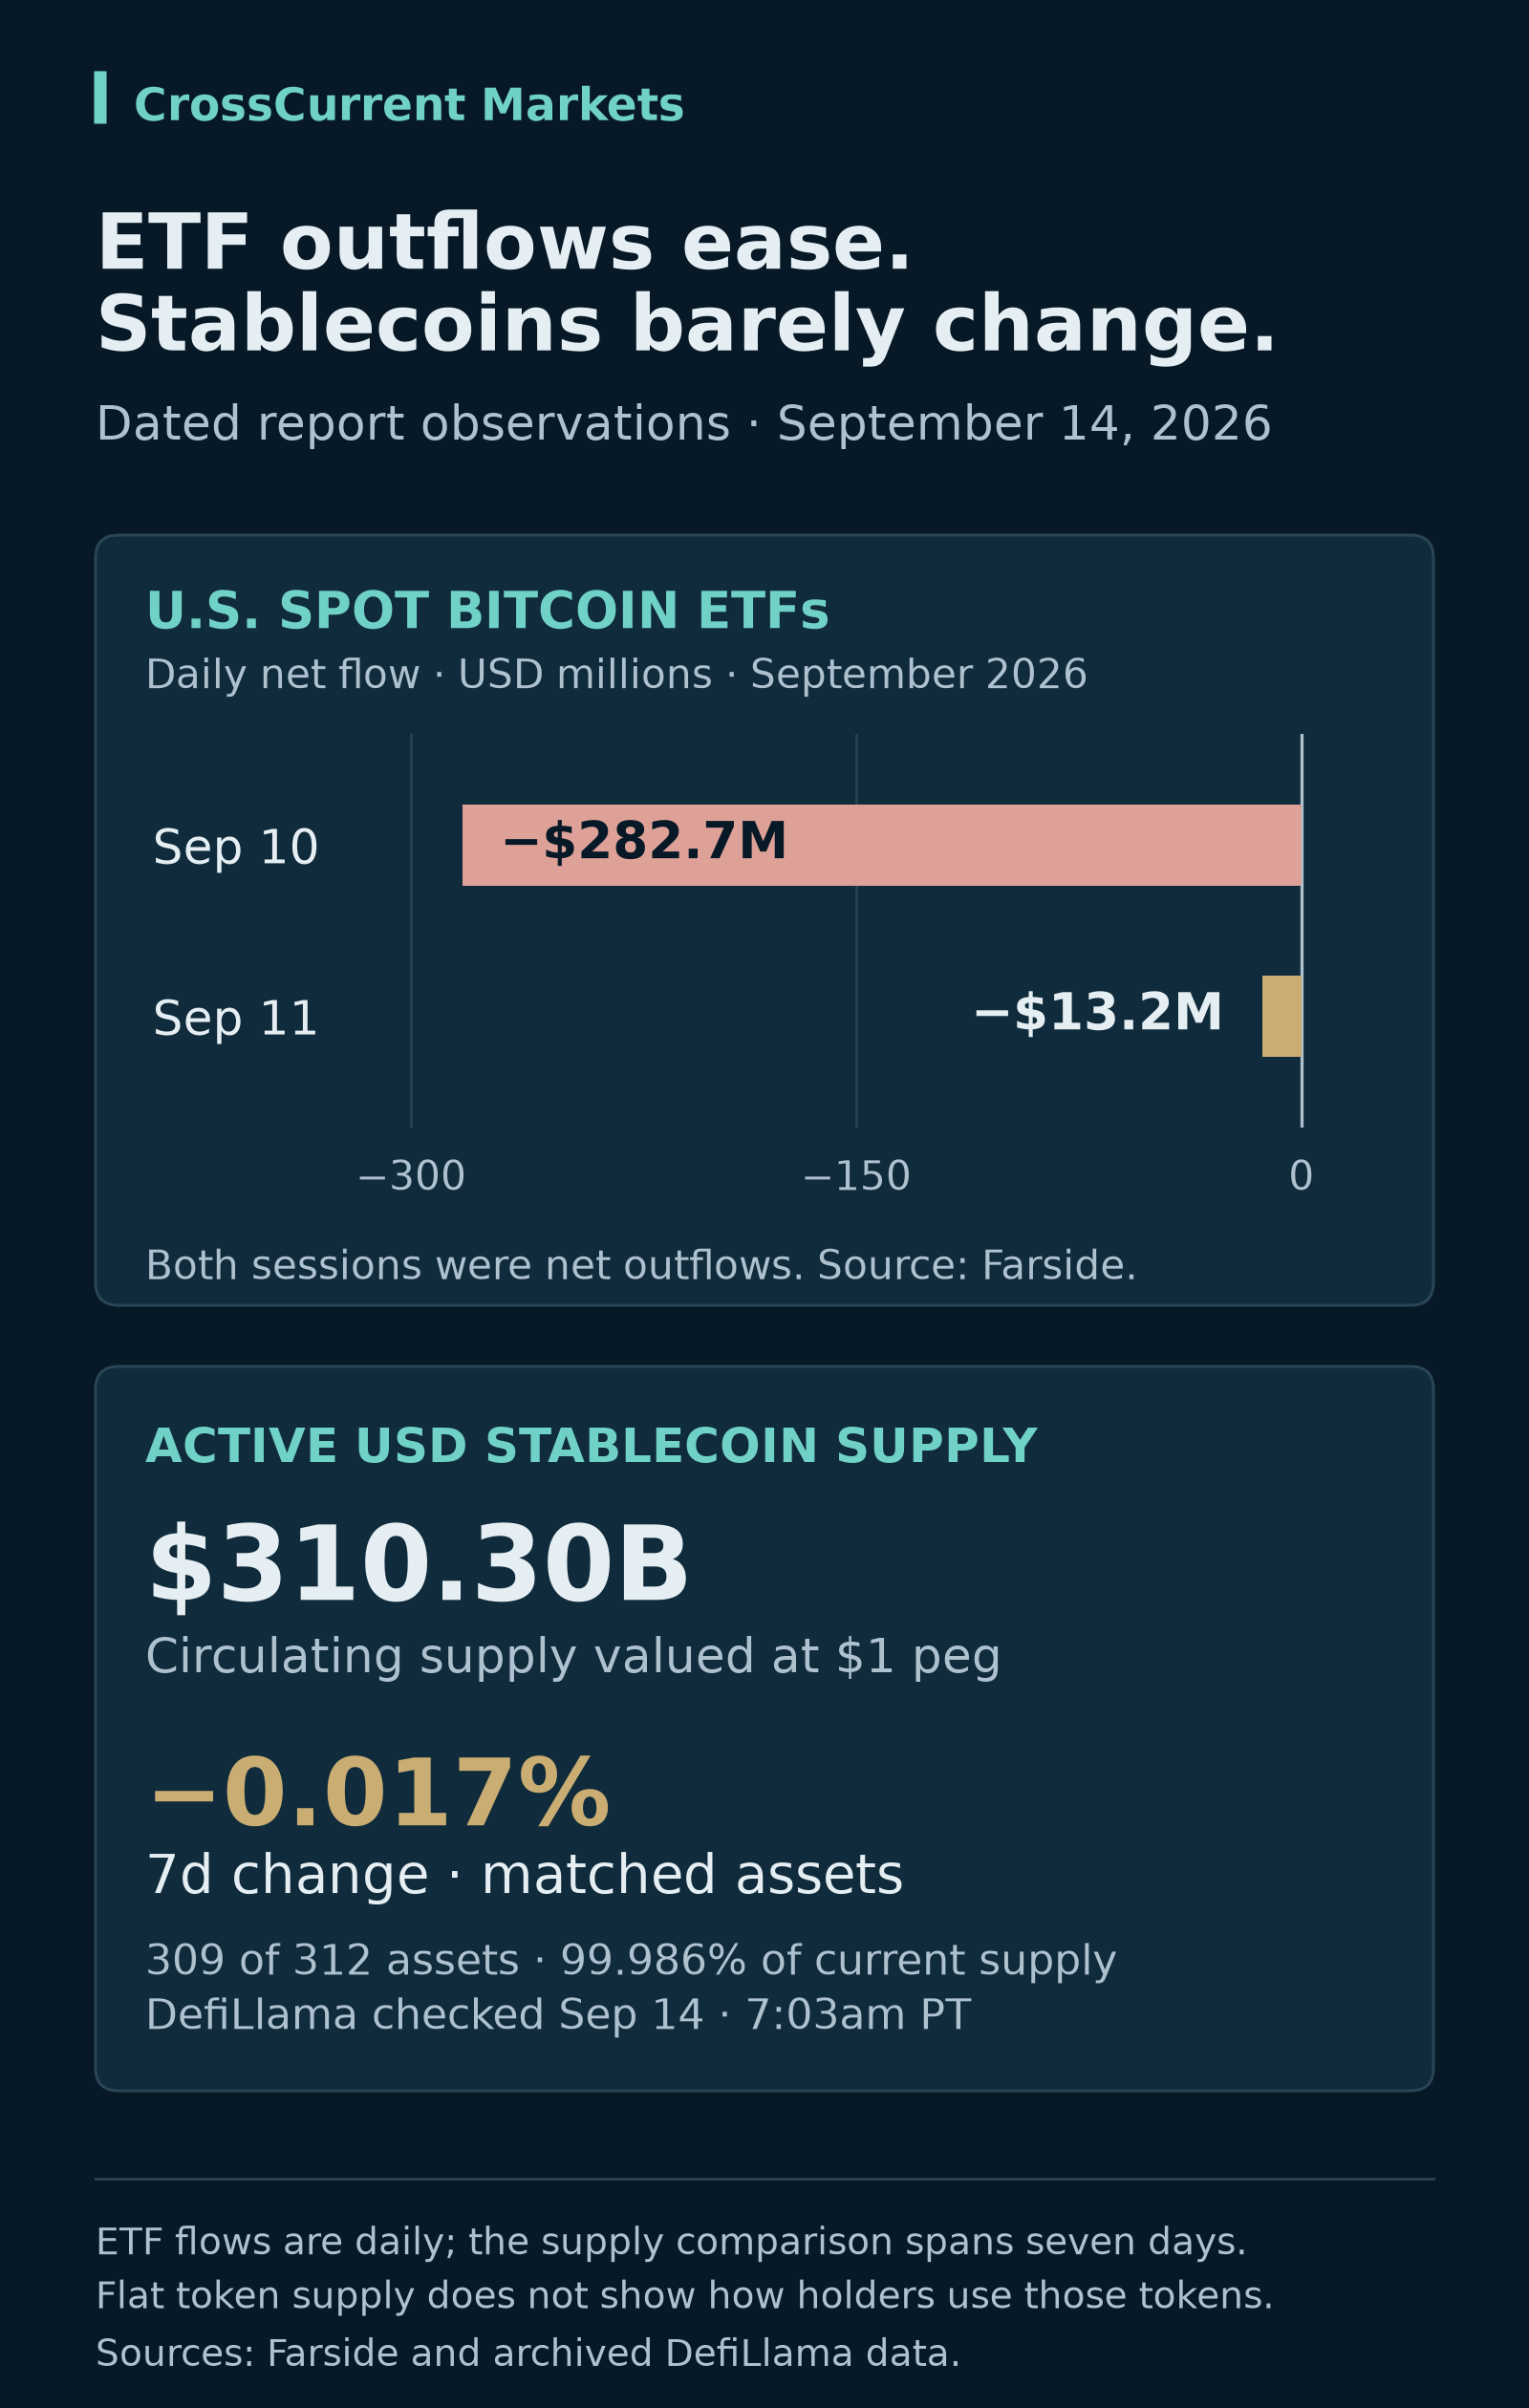
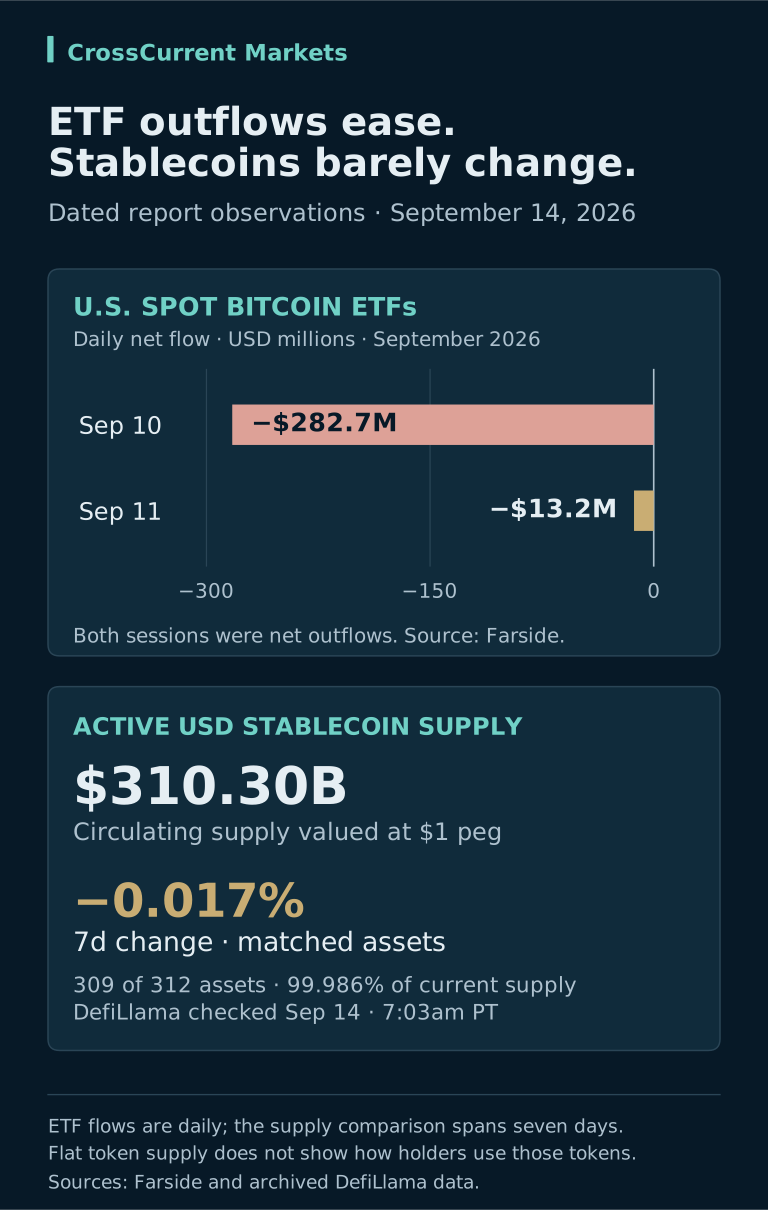
Farside reported $13.2 million of net outflows on Friday, September 11, after $282.7 million on Thursday, September 10. Friday was an improvement relative to Thursday, while both sessions remained negative. Farside's U.S. Bitcoin ETF table.
Our reading is deliberately narrow. The comparison supports “outflows eased”; it does not yet support “inflows resumed” or “a sustained demand trend began.” Those conclusions would need subsequent complete observations.
Completeness matters before arithmetic. At the morning cutoff, Monday's fund entries were unreported. We treated the day as pending. An apparent zero total above missing entries cannot establish that the session finished with no net flow. The same principle applies when only some funds have reported: record the partial coverage rather than compare a partial day with a complete one.
For a meaningful follow-up, we would examine persistence across complete sessions and whether flows are concentrated in one product or more widely distributed. That would add information beyond repeatedly describing the latest single-day change.
Stablecoin supply measures a stock of tokens
Our website's stablecoin measure uses DefiLlama's per-asset circulating-supply fields. It includes active USD-pegged assets, excludes records flagged as delisted, deprecated or already dead, and values the included units at their dollar peg. It does not multiply each supply by a fluctuating token price or add the per-chain breakdowns to the same asset total. DefiLlama public data.
This is our stated measurement convention. The resulting figure describes supply at peg; it is not an audit of backing assets or a guarantee that each token trades or redeems at one dollar.
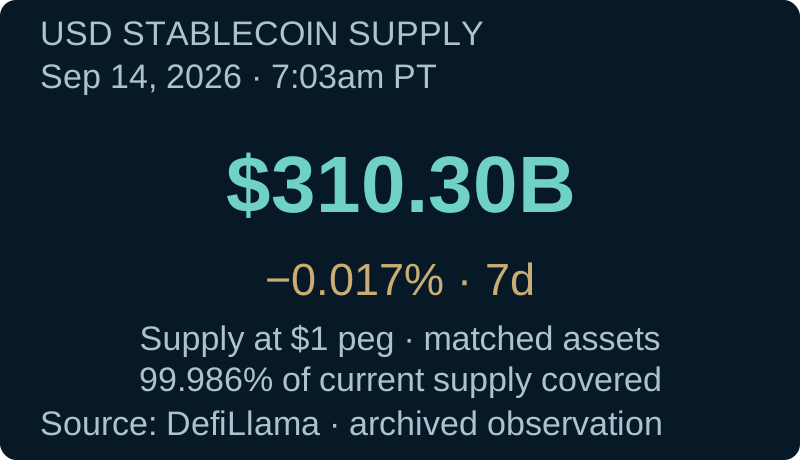
At the September 14, 7:03am Pacific Time check, that total was $310.30 billion after rounding. A large outstanding balance may be relevant to crypto trading capacity, but its size does not tell us the holders' next action. Tokens might be transferred between existing users or used for purposes other than buying Bitcoin.
This distinction is central to our interpretation. Supply growth can be evidence that the stock of available dollar-linked tokens is expanding. Whether it supports BTC demand remains a separate question. Flat supply can also coexist with substantial trading: existing units need not be newly issued each time they change hands.
Compare the same assets over time
Not every asset with a current supply has usable prior-week data. Treating missing history as zero would manufacture growth. Comparing a full current total with a smaller historical asset set would create a similar problem.
Our September 14 seven-day comparison used only assets with both observations. 309 of 312 active assets qualified, covering 99.986% of current supply. The matched current balance was approximately $310.2517B, compared with $310.3045B a week earlier. Applying (current ÷ prior − 1) × 100 to the unrounded matched totals gives −0.017% after rounding. These calculations use the archived DefiLlama response under the stated method.
The headline total and percentage comparison therefore have slightly different coverage. We show that distinction instead of hiding it behind a single precise-looking percentage.
Our description was “nearly flat.” That preserves the small negative sign without treating a tiny change as evidence of a major contraction. It also keeps a decimal-level calculation from implying more certainty about demand than the measurement provides.
Read combinations as hypotheses to investigate
| Hypothetical combination | Our next research question |
|---|---|
| Sustained ETF inflows and expanding comparable stablecoin supply | Does price and market participation also show broader support? |
| ETF outflows and expanding stablecoin supply | Is demand weakening in the fund channel while token balances build for other uses? |
| ETF inflows and flat or falling stablecoin supply | Is the fund channel providing support that differs from activity represented by stablecoins? |
| ETF outflows and contracting stablecoin supply | Does other evidence confirm weaker funding or demand, and over what horizon? |
These combinations are examples of questions, not validated predictions. The same apparent combination can occur for different reasons, and data coverage or timing may account for part of the difference.
The September 14 comparison itself mixed daily ETF sessions with a seven-day stablecoin window. Putting them beside one another was useful context, but did not make them synchronized flows or prove that one caused the other. A causal claim would require additional evidence.
For the next report, the most useful update will be whether complete ETF observations show persistence, whether the comparable supply measure changes meaningfully, and whether price and market structure reinforce the emerging interpretation. Each update should preserve its provider, observation window and limits.
Read more in our Bitcoin ETF guide, stablecoin liquidity guide, and explainer on why market capitalization is not money flow.
Educational research. The September 14 figures are a dated example, not live measurements or personalized investment advice.
Archived report · September 14, 2026. Values retain their original dates.