
Historical report · observations from September 25, 2026
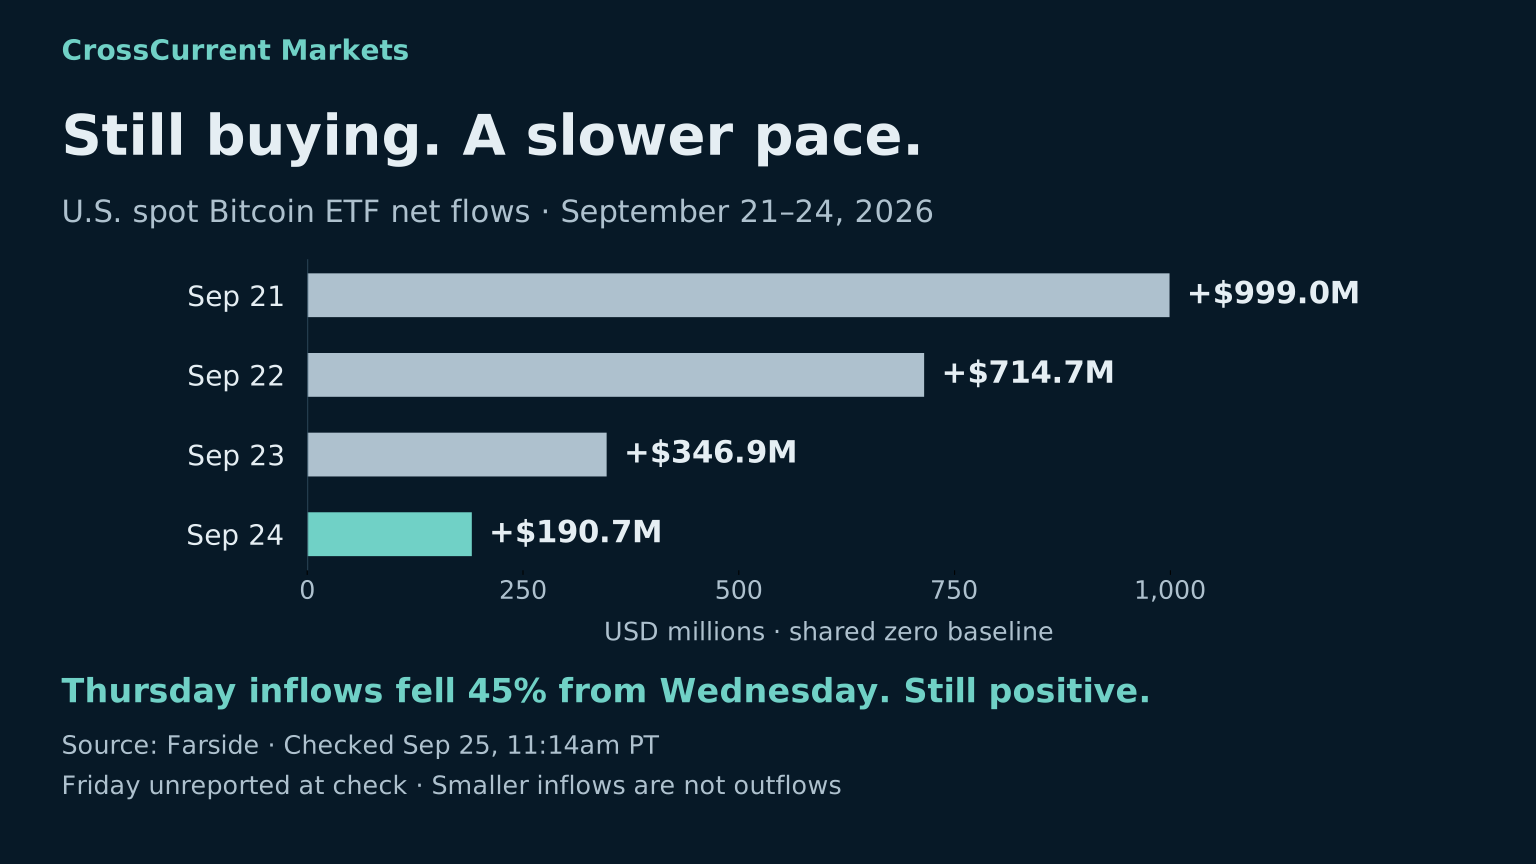
Demand slowed Thursday ETF inflows +$190.7M, down 45% from Wednesday.
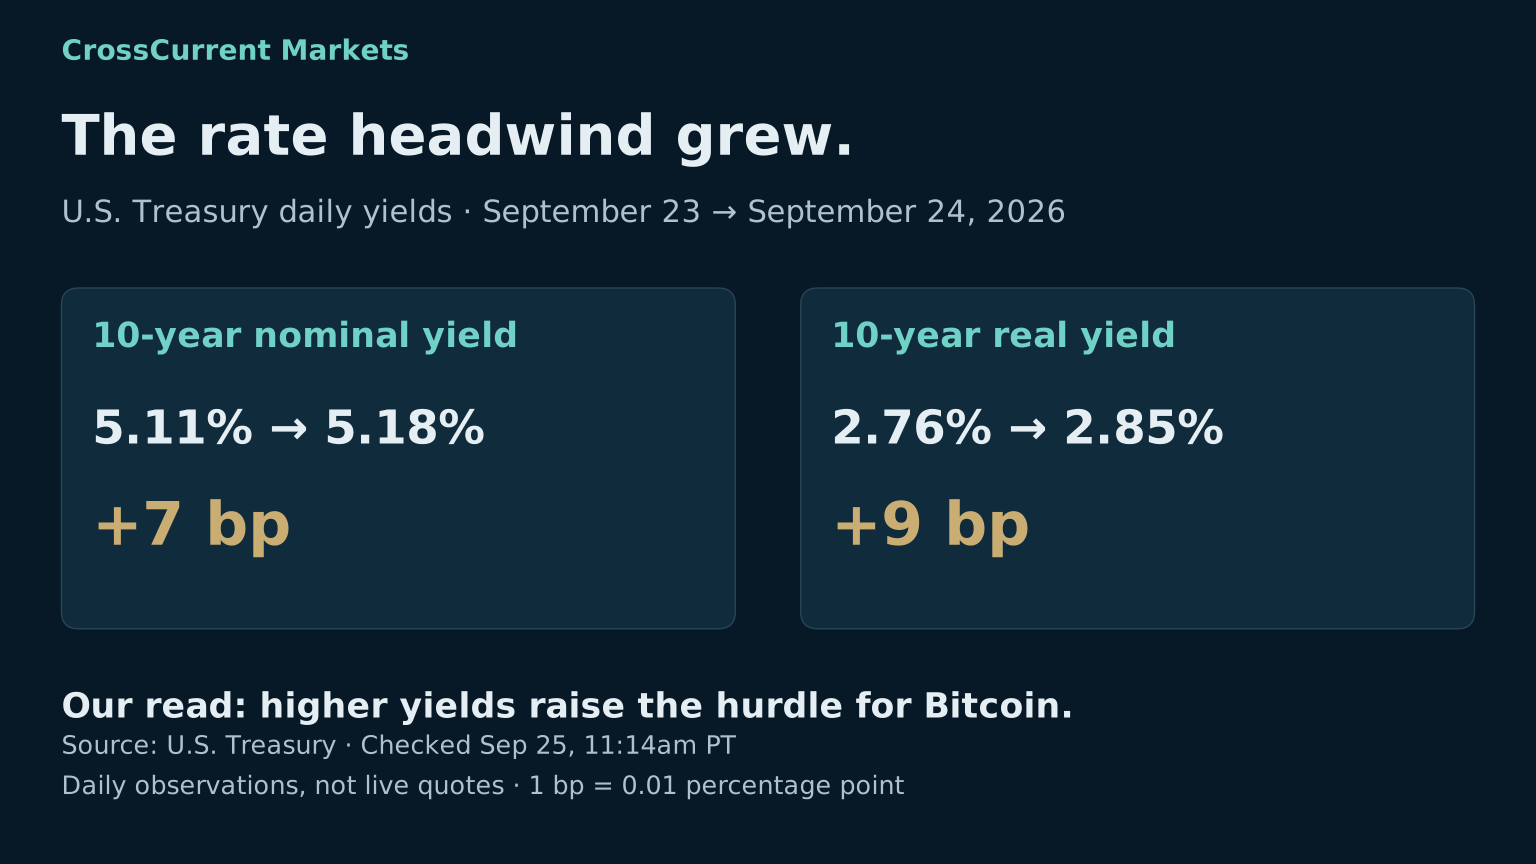
Rates rose Ten-year nominal yield 5.18%; real yield 2.85%.
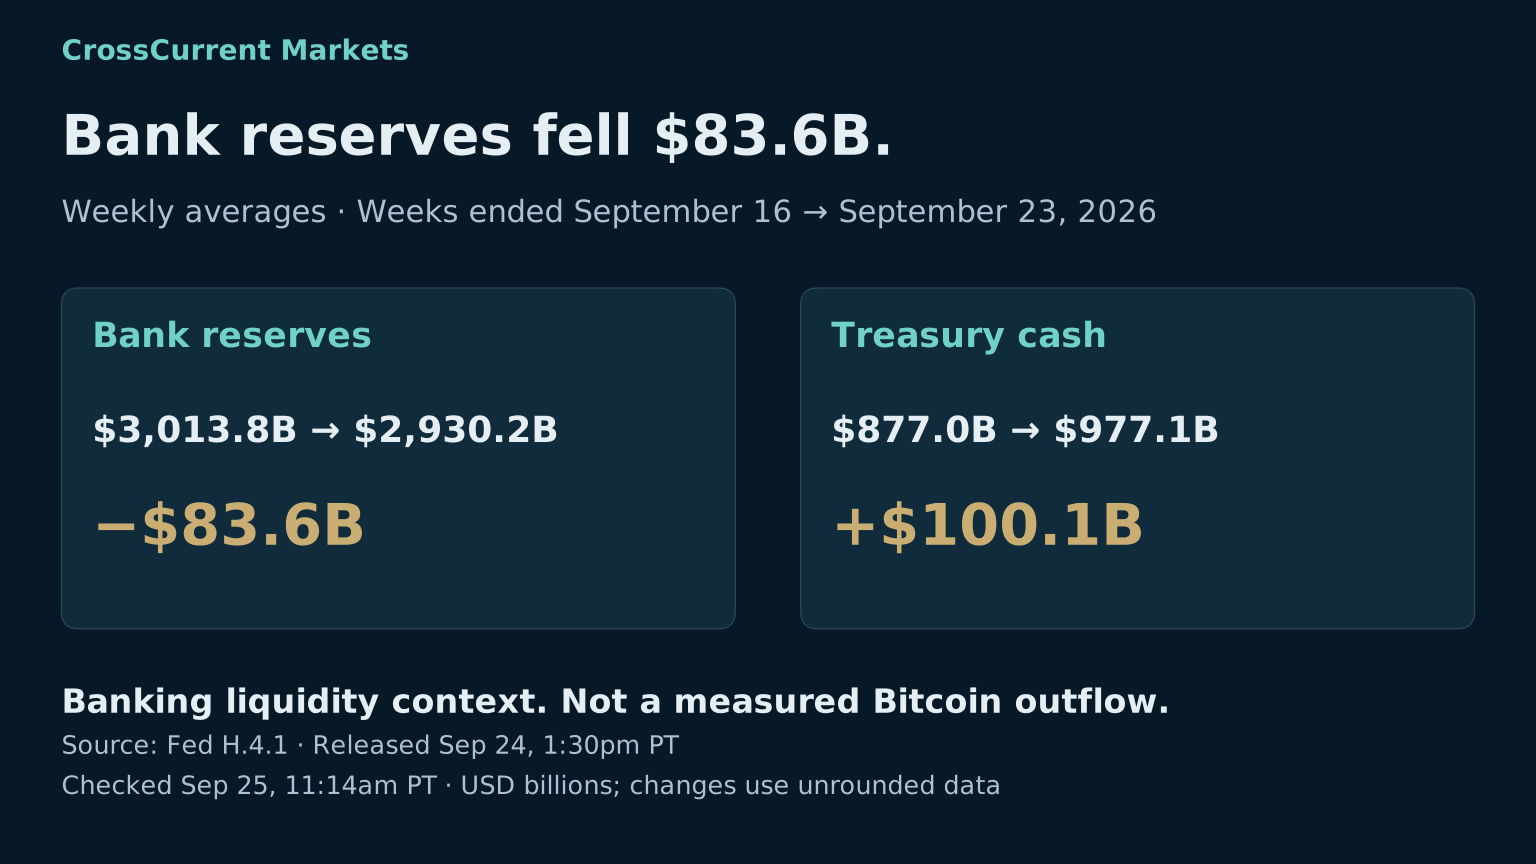
Reserves fell Weekly average bank reserves down $83.6B.
Read the full analysis and sources
Bitcoin still has ETF buyers. The latest completed session brought another net inflow, but the amount fell 45% from the day before. At the same time, Treasury yields rose and the Federal Reserve's latest weekly figures showed lower bank reserves. Our assessment remains mixed: demand through investment funds is holding up, while financing and banking-liquidity conditions offer less support.
The counterevidence matters. Stablecoin supply expanded over its measured week, implied volatility eased, and the latest dealer survey did not show broad deterioration in financing terms. These observations describe different markets and periods. They do not establish a single liquidity score or explain Bitcoin's entire price move.
Quote and timing: Coinbase BTC-USD was $83,947.48, down 0.60% over that response's rolling 24-hour window, checked September 25 at 11:10:55am PT. Price and return use the same response. The endpoint does not supply the actual last-trade timestamp; this is a check time. The morning check at 7:05:40am PT was $83,250.04 and -0.47% over its own rolling window. These are separate snapshots, not a measured return between the checks. Other series keep their observation dates below.
ETF buyers stayed active, but the pace slowed
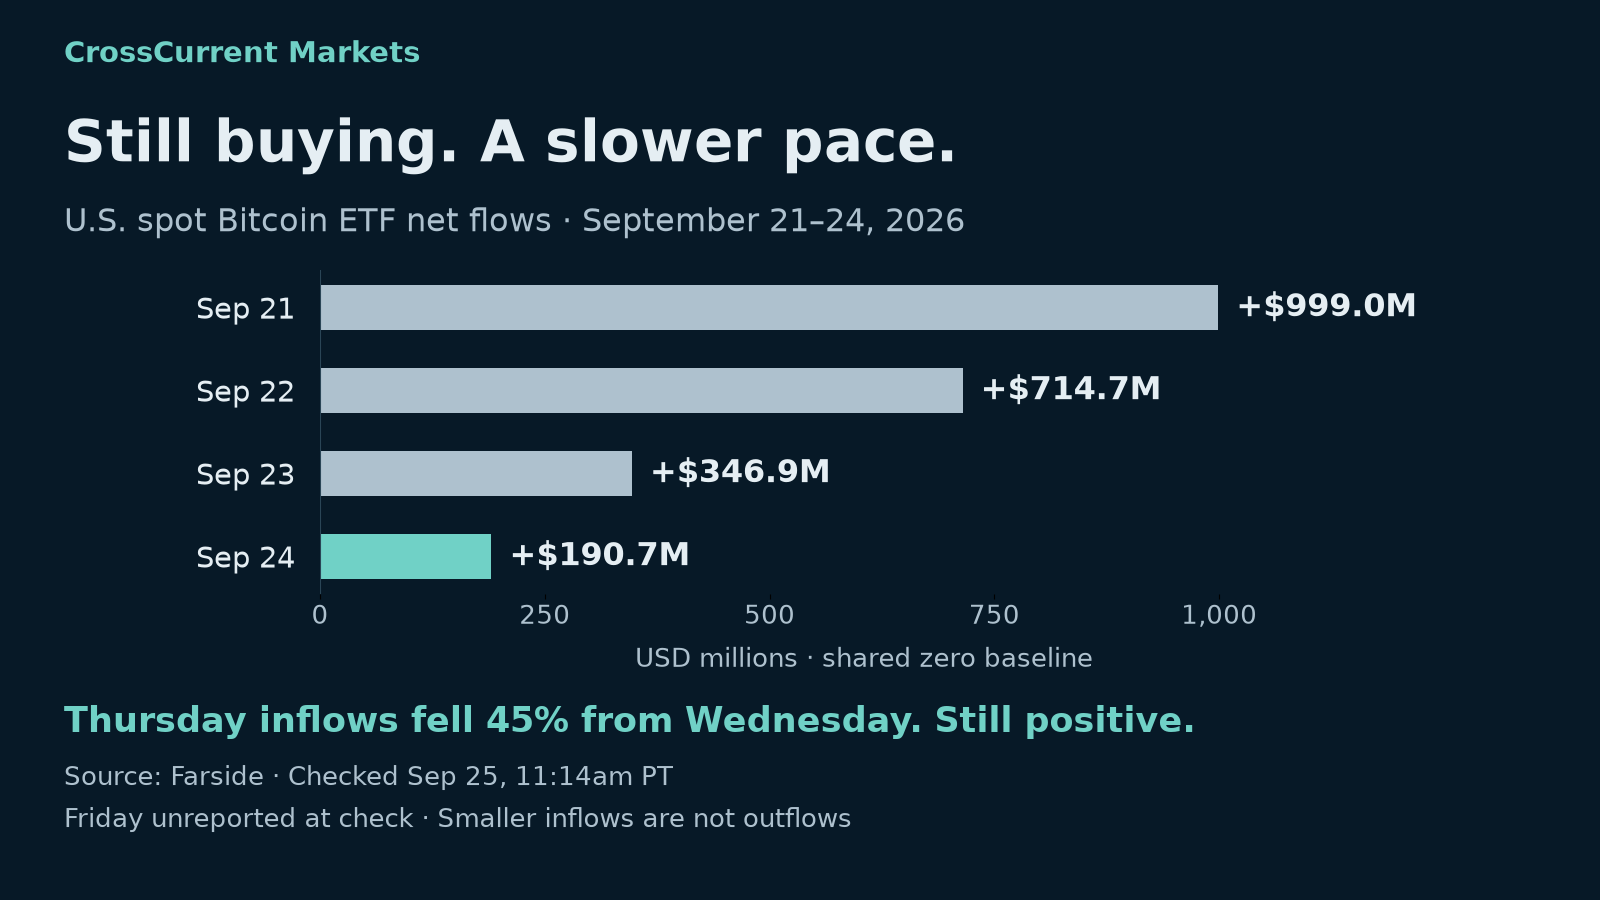
Farside's completed September 24 row shows $190.7 million of U.S. spot Bitcoin ETF net inflows, versus $346.9 million on September 23. That is $156.2 million less, a 45.0% decline in the daily inflow amount. It is still buying on net, not an outflow.
The four sessions from September 21 through 24 accumulated $2,251.3 million. Thursday was the sixth consecutive positive session. Five funds had positive flows, one was negative and six were zero. The chart uses a shared zero baseline so the smaller positive bars cannot be mistaken for selling.
Our interpretation: these products continue to absorb demand, but the pace alone does not establish an accelerating bid. Flows cover these funds, not every Bitcoin trade or investor motive. Friday's twelve fund entries were still missing at the 11:14am PT check. The displayed total of zero is a placeholder, not a completed zero-flow day. Farside is a compiler; we have not independently reconciled every issuer.
Higher yields raise Bitcoin's hurdle
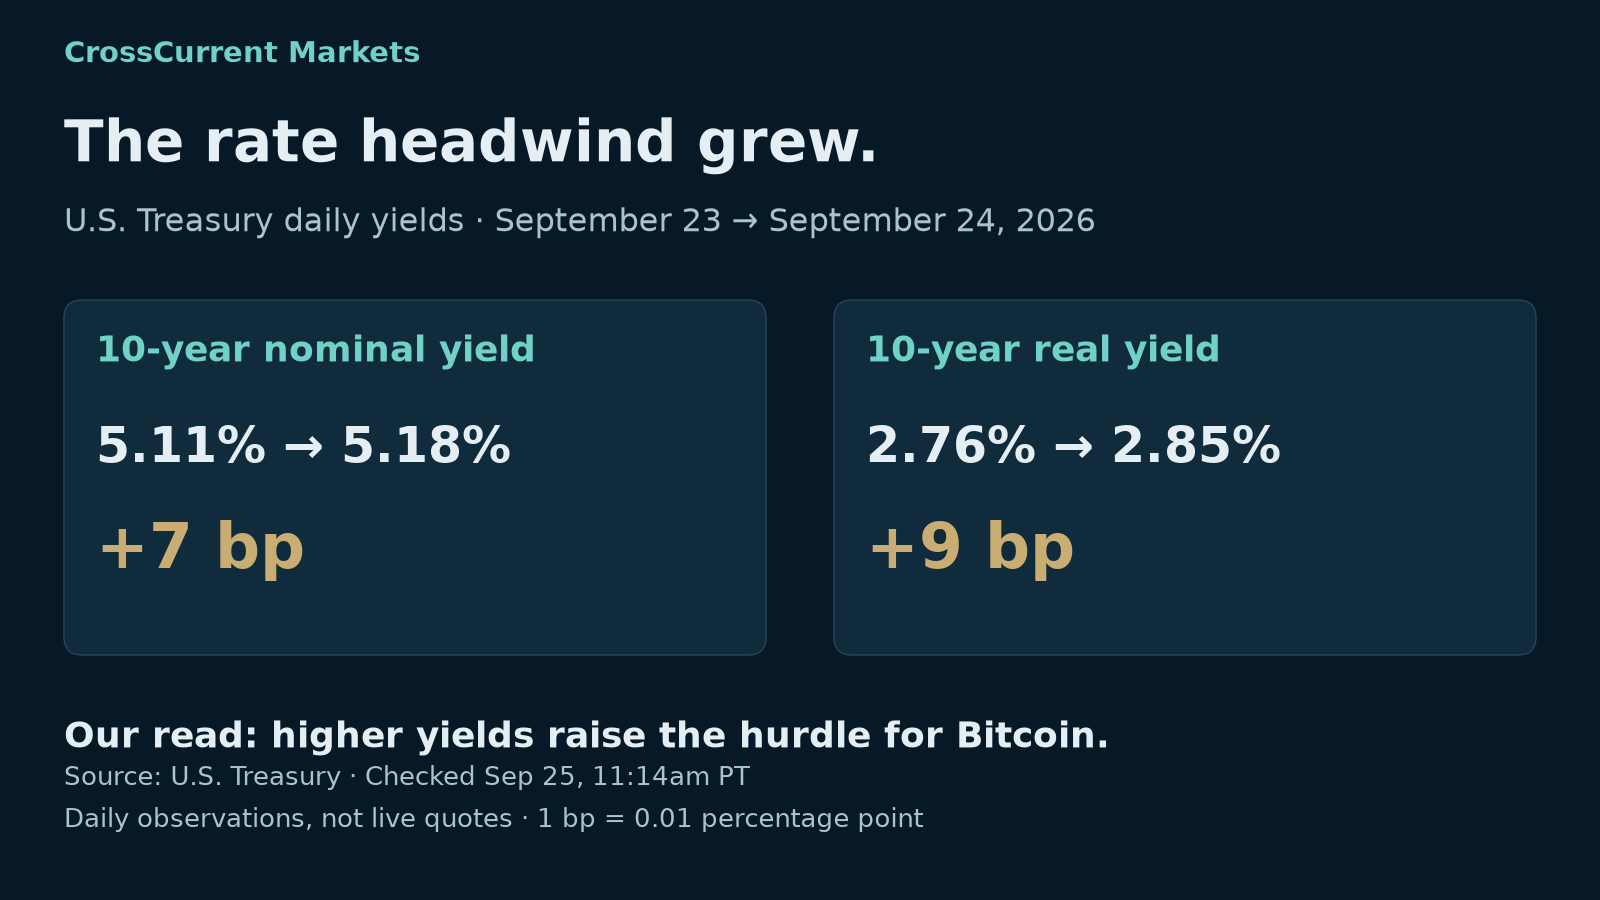
The Treasury's September 24 nominal curve put the two-year yield at 4.87%, up two basis points from September 23, and the ten-year at 5.18%, up seven. The ten-year real yield rose nine basis points to 2.85%. One basis point equals 0.01 percentage point.
Higher interest-bearing returns can increase the opportunity cost of holding Bitcoin and make financed risk-taking less attractive. That is a possible transmission channel, not proof of what caused the spot move. These are Thursday's indicative daily observations, rechecked at 11:14am PT on Friday; they are not Friday live bond quotes.
The earlier report's condition was that sustained fund demand would look more supportive alongside rate relief. The next daily observation delivered the demand, but not the rate relief. That conditional assessment remains intact; it is not a scored price forecast.
Bank reserves fell as Treasury cash rose
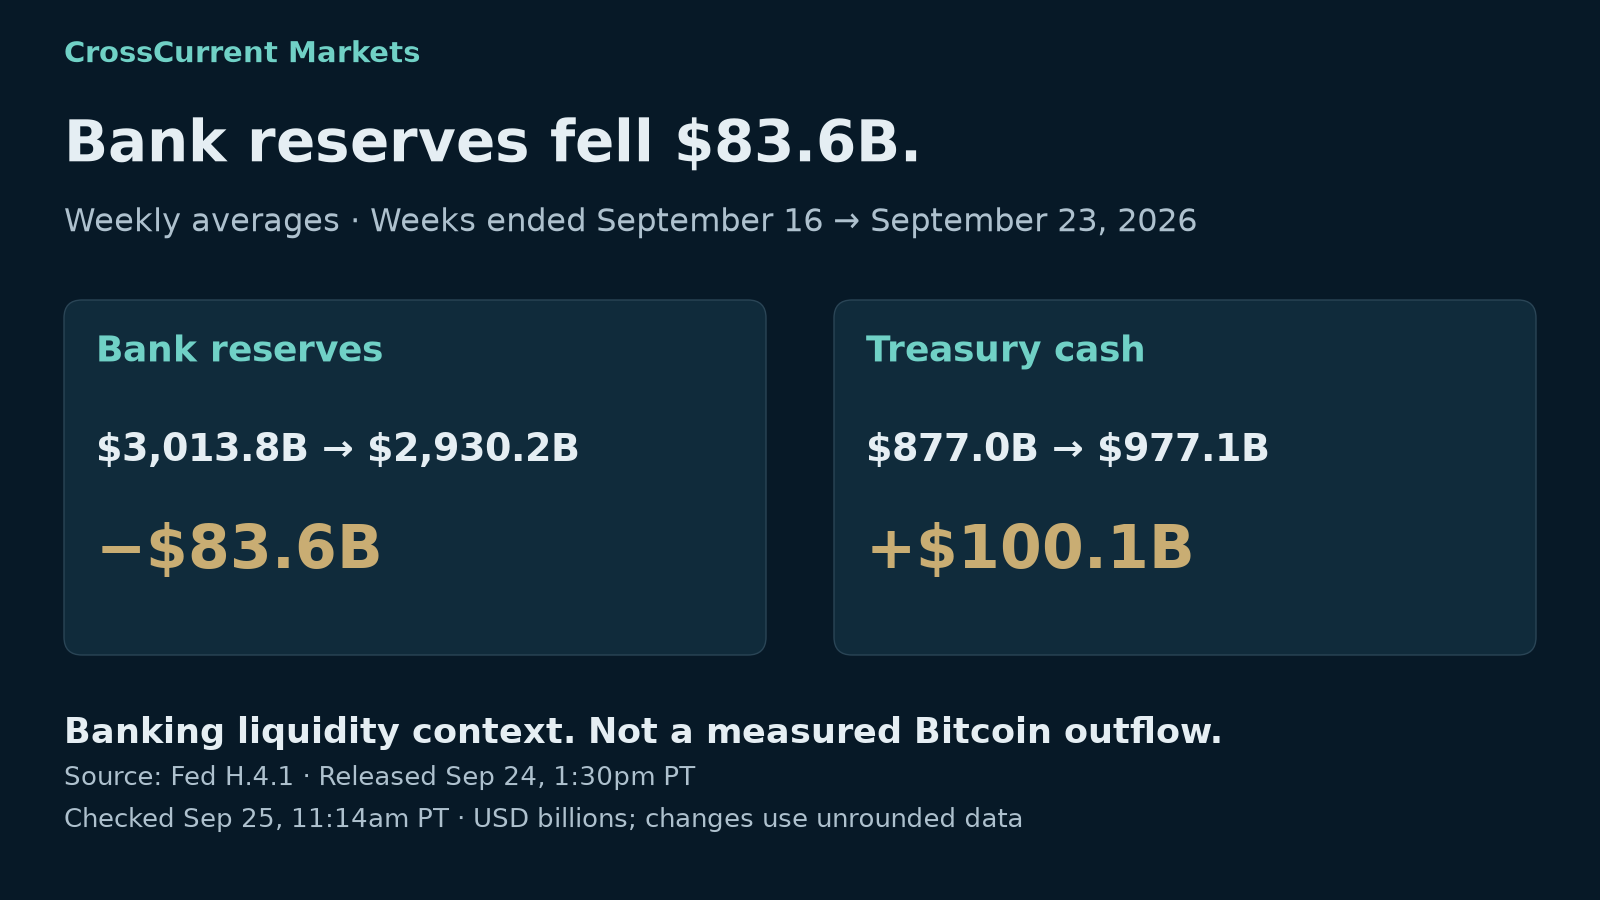
The September 24 Fed H.4.1 release reported average bank reserves of $2,930.193 billion for the week ended September 23, down $83.601 billion from the prior week. Average Treasury General Account cash increased $100.056 billion to $977.084 billion. Reserve Bank credit increased $4.030 billion.
Treasury cash accumulation is one factor that can absorb reserves; other balance-sheet changes also matter. The chart compares weekly averages with weekly averages. Wednesday's point-in-time balances are a different series and are not substituted into that calculation.
Our read is a less supportive banking-liquidity observation, not evidence that $83.6 billion left Bitcoin. Nor is the weekly result a forecast of the next week's direction. The release arrived September 24 at 1:30pm PT and was rechecked September 25 at 11:14am PT.
The New York Fed's overnight operation results add a newer daily observation: September 25 reverse-repo usage was $576 million, versus $630 million Thursday. September 24 effective federal funds and SOFR rates were both 3.88%; SOFR was up one basis point. The facility result is not a measure of total market liquidity.
The supportive counterpoint: more stablecoin supply
The 11:10am PT refresh of DefiLlama's active USD-pegged assets measured $312.054 billion of supply at peg. Matched assets increased 0.839% over seven days. The comparison includes 313 of 314 assets and 99.997% of current supply; assets without a valid prior balance are not treated as having started at zero.
This is a larger pool of dollar-linked tokens available for trading, settlement, payments, collateral or idle balances. It does not demonstrate that the increase bought Bitcoin. The morning snapshot was $311.399 billion with 0.634% matched weekly growth. The provider updates continuously and does not expose an individual asset update clock in this response, so the change between checks is not labeled a new four-hour cash inflow.
Stablecoin balances, ETF flows and bank reserves cannot be added together. They have different definitions, overlapping possible uses and different comparison windows.
Crypto market structure remains mixed
At the 11:10am PT refresh, CoinLore's market-cap shares were 58.75% for BTC and 11.58% for ETH. In its top-five sample excluding USDT, ETH and XRP were up over 24 hours while BTC and BNB were down; all four were positive over seven days. Four assets do not establish whole-market breadth, and relative-price changes can shift dominance without identified cash transfers.
Deribit's public data showed DVOL declining from 35.78 to 34.74 between completed 10–11am PT hourly closes on September 24 and 25. This is a 30-day annualized implied-volatility index, not a price-direction signal. The incomplete 11am–noon PT interval was excluded.
At the refresh, Deribit BTC-PERPETUAL open interest was $914.660 million and eight-hour funding was approximately +0.000004%. These figures describe one venue and instrument; USD open interest also changes with valuation. They do not establish marketwide leverage, a liquidation event or short covering. Coinbase's ETH-USD response returned $2,691.42 and +0.08% over its own rolling day; provider return windows should not be mixed.
U.S. growth and financial stress do not give one clean answer
The Census durable-goods release, published September 25 at 5:30am PT, estimated August nominal, seasonally adjusted orders at $338.6 billion, virtually unchanged from July. Excluding transportation, orders rose 0.3%. These advance figures can be revised. They describe mixed manufacturing demand and do not establish a policy-easing signal or a surprise relative to consensus.
Other observations retain the periods checked in the morning:
| Measure | Dated observation | Why the qualification matters |
|---|---|---|
| High-yield credit spread | September 23: 2.73%, up five basis points | A wider spread, but not a live Friday stress measure |
| National Financial Conditions Index | Week ended September 18: -0.555, versus revised -0.557 | Still below its historical average; weekly rather than daily |
| Initial unemployment claims | Week ended September 19: 197,000, versus revised 198,000 | The prior estimate was revised; comparisons must use the same vintage |
| New-home sales | August: 684,000 at a seasonally adjusted annual rate | Estimated +6.4% monthly change has a 90% margin of ±19.5 percentage points |
| Consumer prices | August headline CPI: +0.4% monthly, +3.4% yearly; core +0.3%, +2.4% | Monthly inflation context, not a fresh daily observation |
| Employment | August payrolls +162,000; unemployment 4.1% | A monthly snapshot, not a new Friday release |
Sources: ICE BofA through FRED, Chicago Fed, Labor Department, Census, BLS CPI and BLS employment. The housing estimate's uncertainty interval spans zero, so it does not establish a clear monthly rebound.
The Fed's September dealer survey found financing terms and leverage broadly unchanged on net during June–August. More than one-fifth of dealers reported wider spreads on equity collateral financing. This is useful counterevidence to a broad stress narrative, but it predates this week's yield rise and does not measure household loan terms or daily private-credit defaults.
Global conditions: dated policy moves, uneven data coverage
The international evidence is not a synchronized global-liquidity index. The morning checks confirmed the following context; it was not refreshed into a new common observation period for publication.
| Region or measure | Evidence | Relevance and limit |
|---|---|---|
| Eurozone | ECB (European Central Bank) raised rates 25 basis points September 10; deposit rate 2.50% effective September 16 | A dated policy constraint, not today's realized liquidity |
| Japan | Deposit rate 1.25% and basic loan rate 1.50% effective September 24; a September 25 funding-operation notice moves to floating rates | The operating-method change does not quantify a new easing injection |
| Japanese balance sheet | September 20 assets ¥641.281 trillion; current deposits ¥410.253 trillion, published September 25 | No compatible prior balance extracted; no trend asserted |
| China | Latest checked materials-price release covers September 11–20: 21 of 50 categories rose, 26 fell, three were flat | Limited price evidence; the PBOC report body and latest official loan prime rate remain unverified |
| South Korea | August 27 rate increase of 25 basis points to 3.00% | One country's policy, not a complete Asian macro reading |
| Cross-border credit | BIS end-March bank credit $39.5 trillion, +11% year over year | Older cross-border bank-credit context, not total current global liquidity |
Sources: ECB (European Central Bank), Bank of Japan decision, new operation notice, Bank of Japan balance sheet, China NBS, Bank of Korea and BIS.
The Fed's H.10 still provided September 14–18 FX observations in the morning check. The broad dollar index rose about 0.69% across that dated window; this is not today's DXY or live FX. The September H.6 release put August seasonally adjusted M2 at $23,342.8 billion, up $124.9 billion from July. Monthly money stock should not be presented as a Friday liquidity impulse.
Private credit, AI funding and cross-asset context
A new Bank of Japan research paper examines asset-based and semi-liquid private-credit funds and connections to Japanese financial institutions. It adds structural risk context rather than a daily default measure. The authors' views are not necessarily the bank's official position.
Oracle's first-quarter fiscal 2027 release reported $20 billion of common-stock funding through its at-the-market program before commissions. That documents capital raising. It does not show that money moved from Bitcoin into AI, or that all proceeds were already spent. A causal rotation claim would require evidence of the relevant purchases, sales and financing flows.
The Nasdaq-100 closed September 24 at 30,478.86, approximately 0.03% above the previous close. That daily window differs from the rolling crypto returns. The World Gold Council's August-end figure, $4,563 per ounce, remains dated monthly context and is too old for a current gold-versus-Bitcoin comparison. Neither observation proves capital rotation.
Regulation and source gaps
The CFTC's September 24 staff FAQ update addresses tokenized permitted customer-fund investments and blockchain recordkeeping. Its scope does not amount to blanket crypto approval or a Bitcoin purchase. A September 25 enforcement announcement concerns an alleged retail-forex fraud scheme, not a new Bitcoin-market rule. The allegations should not be presented as adjudicated findings.
The SEC press-release index, unavailable during the morning run, loaded during the publication refresh. Its newest listed entries were dated September 23. This resolves that access gap; it does not prove the absence of every intervening regulatory development.
Some gaps remain material: the alternative ETF feed had ambiguous dates, broader holder and exchange-flow measures were unavailable, and the on-chain feed contained contradictory fee and miner-revenue values. Those fields are excluded. Live gold/FX comparisons and a synchronized global-liquidity aggregate are not established. This article uses independently sourced public observations and editorial interpretation; it is not validated model output and contains no model probability or trading instruction.
What would change the assessment?
Sustained completed-session ETF inflows alongside falling yields would make the demand picture more supportive. Renewed outflows or another increase in yields would strengthen the caution. Growing stablecoin supply is a useful counterpoint, but evidence of how balances are deployed would be needed to translate it into a Bitcoin-demand claim. The horizon is the next completed observations and coming macro releases, not a price target.
| Next check | Scheduled time | Why it matters |
|---|---|---|
| Fed H.8 bank assets and liabilities; H.15 rates | September 25, 1:15pm PT | Updated dated banking and rate context |
| Fed H.10 exchange rates | September 28, 1:15pm PT | Next official weekly FX release |
| August PCE; third estimate of second-quarter GDP | September 30, 5:30am PT | Inflation and growth evidence that may affect rate expectations |
| Advance trade, retail and wholesale indicators | September 30, 5:30am PT | Additional activity and inventory context |
Schedules were checked against the Federal Reserve, BEA and Census. Times are Pacific Time for the event date and can change. Friday's ETF session ends at 1pm PT; missing flow data remain pending. There are no regular U.S. equity/ETF sessions over September 26–27, while crypto continues trading.
This report preserves its dated observations and source limitations. Public data can be revised, and a positive reading in one market does not settle the outlook for another.
Archived report · September 25, 2026. Values retain their original dates.