
Historical report · observations from September 24, 2026
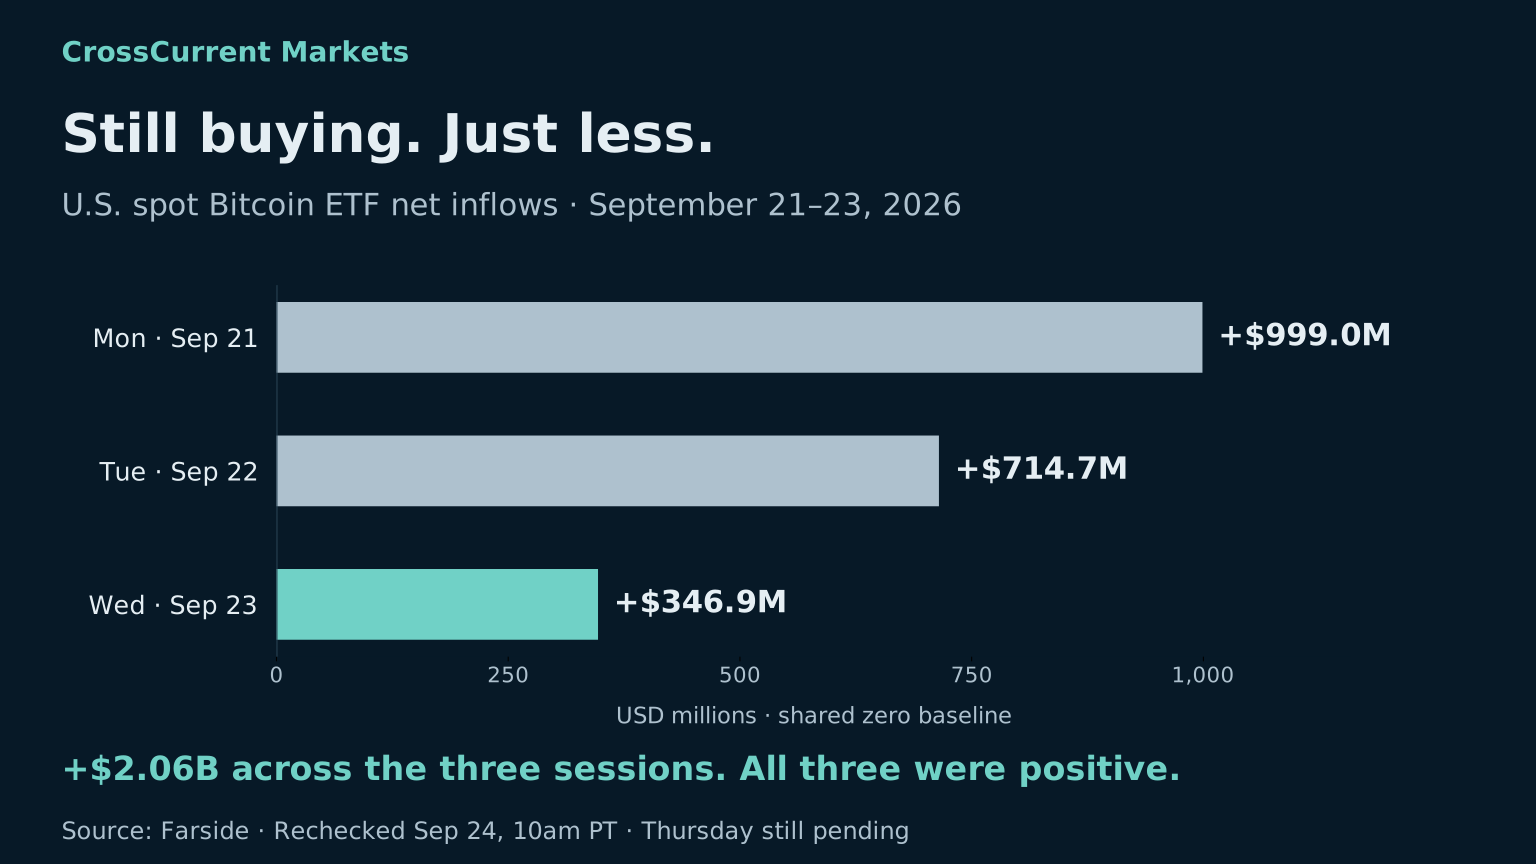
Still positive Wednesday ETF inflows: +$346.9M, below Tuesday.
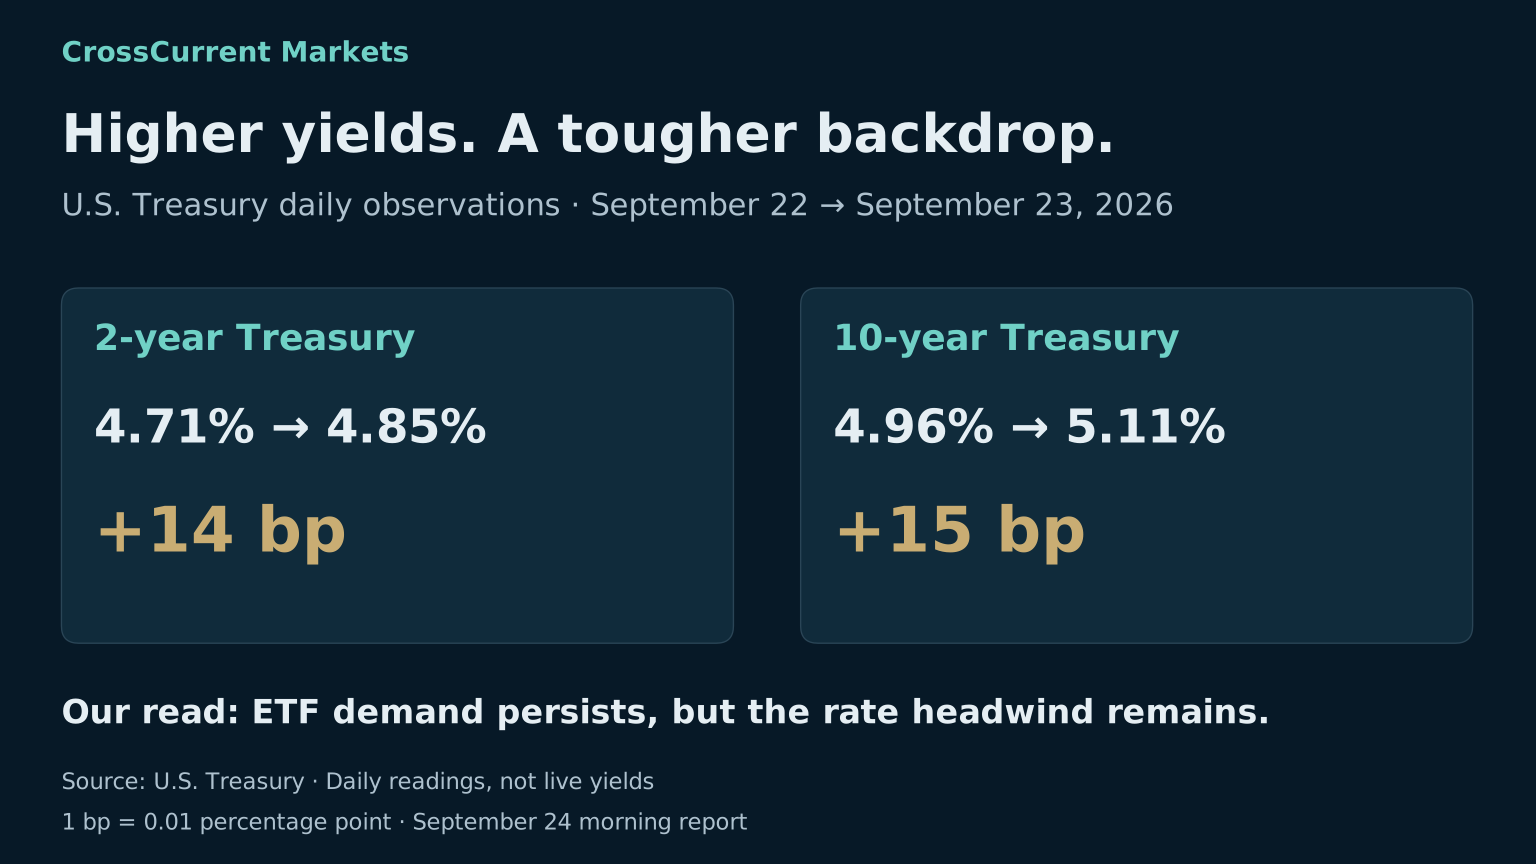
Rates counterweight Latest daily two- and ten-year yields moved higher.
More dollar tokens Matched weekly stablecoin supply expanded 0.770%.
Read the full analysis and sources
Bitcoin’s ETF demand remained positive in the latest completed session. The pace slowed, however, and the latest daily Treasury readings moved higher. Our interpretation is a mixed backdrop: evidence of continued buying, without confirmation that financing conditions are becoming more supportive.
Snapshot timing: The morning report checked Coinbase BTC/USD at 7:03am Pacific: $84,267.74, down 0.30% over that response’s rolling 24-hour window. A publication-time refresh at 10:01am Pacific returned $84,384.09, up 0.08%. These are separate rolling windows, not a measured return between the two checks. Other observations below retain their stated dates. This is a dated report, not a live feed.
ETF inflows slowed, but did not reverse
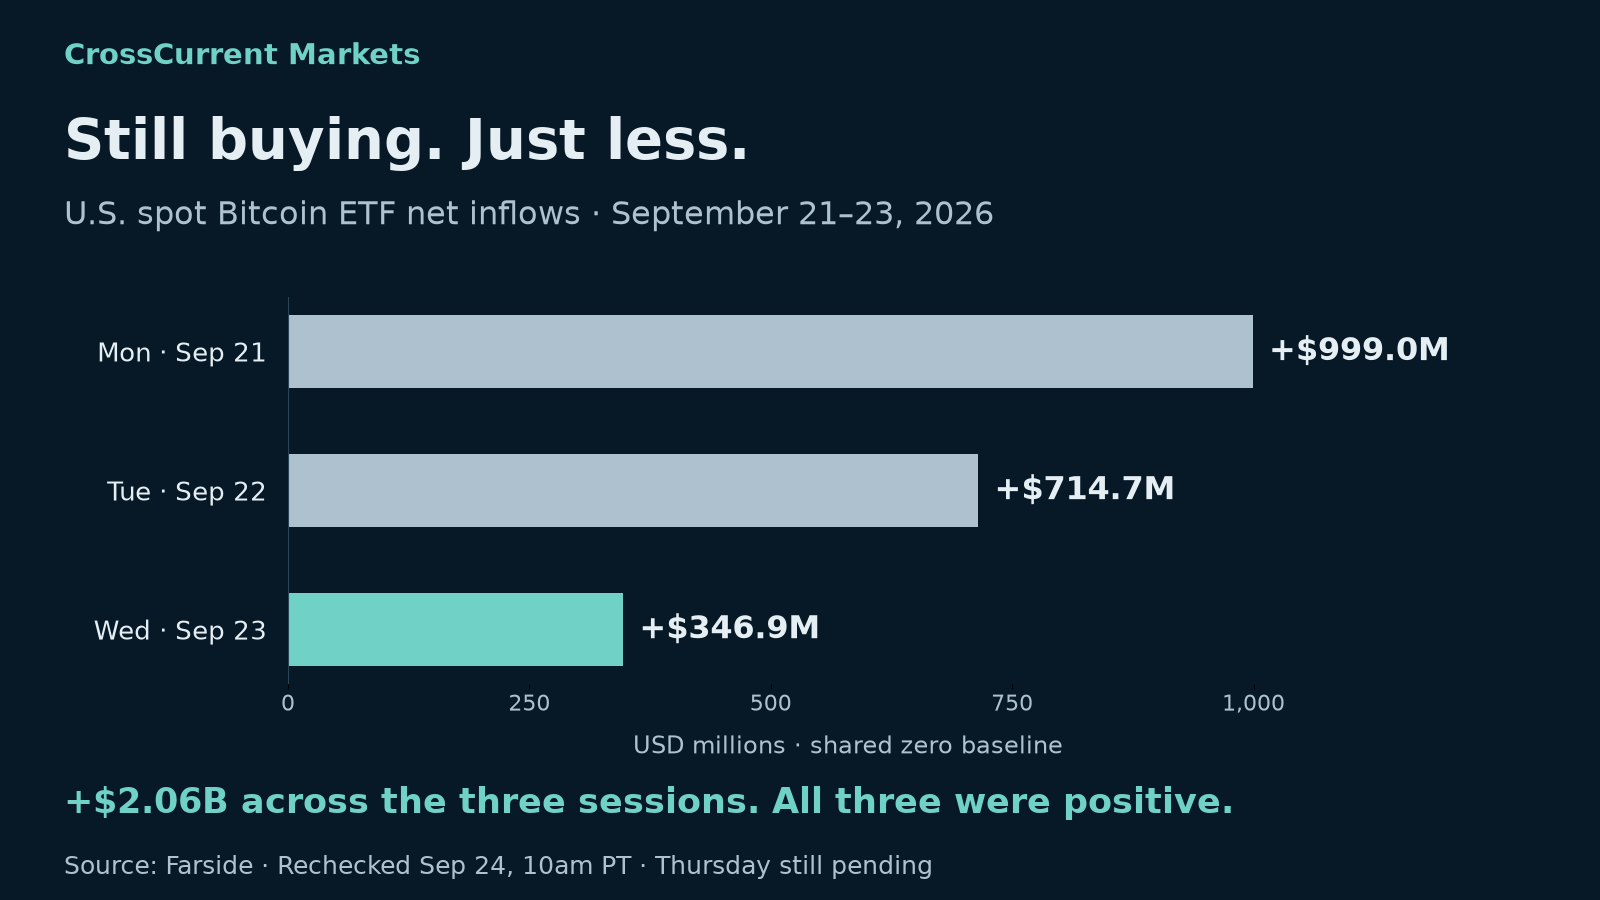
Farside’s U.S. spot Bitcoin ETF table recorded $346.9 million of net inflows on Wednesday, September 23, versus $714.7 million on Tuesday and $999.0 million on Monday. The three-session total was $2,060.6 million. Wednesday was $367.8 million below Tuesday; calling that an outflow would reverse the meaning of the evidence.
Four funds had positive Wednesday flows and eight were zero. The aggregate supports continued demand through these products. It does not measure every Bitcoin buyer and seller, identify a buyer’s motives, or prove why spot price moved. Thursday remained unreported at the publication check: dashes beside the funds are missing data, even if the total field displays zero.
Higher yields remain the counterweight
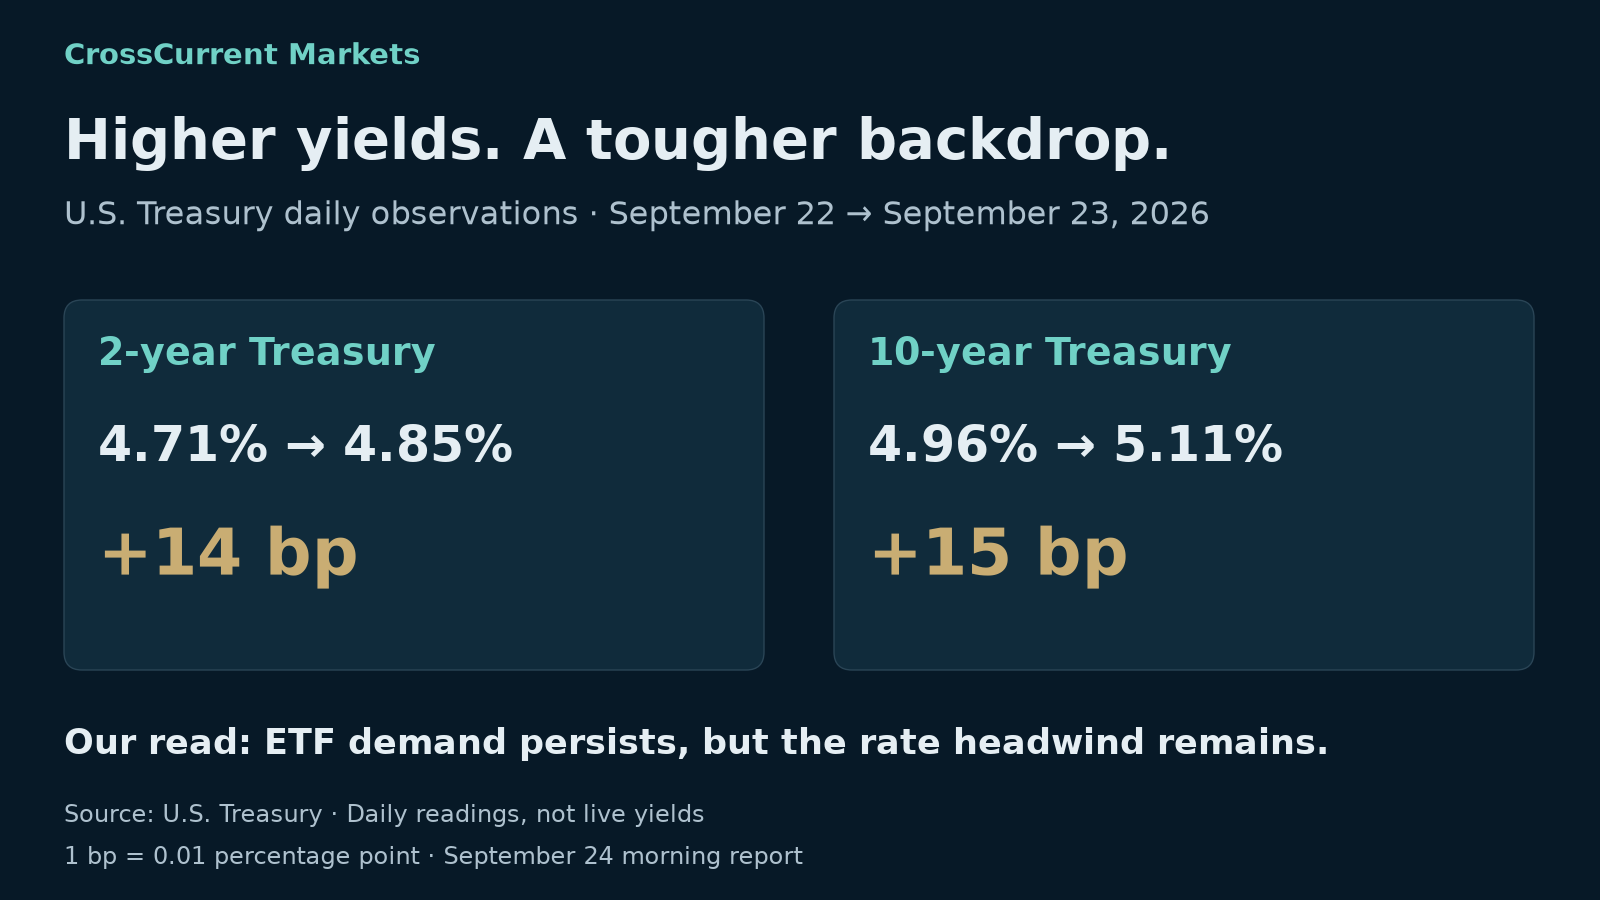
The Treasury’s nominal daily curve showed September 23 two-year yields of 4.85%, up 14 basis points from September 22, and ten-year yields of 5.11%, up 15 basis points. The ten-year real yield rose from 2.63% to 2.76%. One basis point is 0.01 percentage point.
Our read: higher yields can make interest-bearing alternatives more competitive and financing less attractive for risk-taking. Positive ETF flows can coexist with that pressure. These observations do not isolate the cause of Bitcoin’s return. They are Wednesday’s daily readings, not a claim about Thursday’s live bond market.
Stablecoin supply expanded over the week
The 7:03am check of DefiLlama’s stablecoin data put active USD stablecoin supply at $311.89 billion at peg. The matched-assets comparison increased 0.770% over seven days, using 313 of 314 assets and covering 99.997% of current supply.
This is evidence of a larger pool of dollar-linked token supply in the measured set. It is not evidence that the increase was spent buying Bitcoin. Stablecoins can support payments, transfers, collateral, trading and idle balances. Nor should a weekly supply change be added to a daily ETF-flow figure: the measures and windows differ.
The rest of the morning dashboard
| Lens | Latest observation in the morning check | What it does not establish |
|---|---|---|
| Overnight funding | September 23 EFFR 3.88%; SOFR 3.87%, both unchanged from September 22 | A new easing in funding conditions |
| Reserve liquidity | September 23 reverse repo $461 million; the next H.4.1 release was due at 1:30pm PT | Money moving directly into BTC |
| Market structure | CoinLore BTC market-cap share 59.12%; four sampled non-stablecoins down over 24h but up over 7d | Whole-market breadth or returns matching Coinbase |
| Options pricing | Deribit DVOL fell 37.18 to 35.59 between completed 7am PT hourly closes on September 23 and 24 | A direction forecast or absence of risk |
| Credit conditions | NFCI -0.555 for week September 18, versus revised -0.557 a week earlier | A daily stress reading |
Funding and operation records came from the New York Fed. Market structure used CoinLore; options pricing used Deribit; the financial-conditions index came from the Chicago Fed. Each series answers a different question. One venue’s derivative data cannot establish marketwide positioning. Contradictory fee and miner-revenue fields in the morning on-chain feed were excluded rather than interpreted as a collapse in activity.
New economic releases need their qualifications
The Labor Department’s claims release reported 197,000 initial claims for the week ending September 19, down 1,000 from the revised previous week. Comparing against the earlier unrevised estimate would tell a different story. Continuing claims cover an earlier week, September 12, and were 1,719,000.
The Census new-home sales release estimated August sales at a seasonally adjusted annual rate of 684,000, up 6.4% from revised July. But the monthly change’s 90% margin was plus or minus 19.5 percentage points: the range includes both a decrease and an increase. That makes a confident housing-rebound claim premature. The annualized rate is also not the number of homes actually sold during August.
What would change our assessment?
A more supportive combination would be sustained completed-session ETF inflows alongside easing yields. Further yield increases or a reversal in flows would strengthen the caution. Continued weekly stablecoin expansion would add context, but would still need evidence about how those balances are used.
Next checks are Thursday’s completed ETF results, the next Treasury daily observations and the Federal Reserve’s H.4.1 balance-sheet release. Missing data stay pending. The useful question is whether demand and financing conditions improve together—not whether one positive number can carry the whole case.
This report uses public observations and CrossCurrent interpretation. It contains no proprietary model score, probability or trading instruction. Sources may revise their data; the snapshot and its limitations remain dated.
Archived report · September 24, 2026. Values retain their original dates.