
Historical report · observations from September 20, 2026
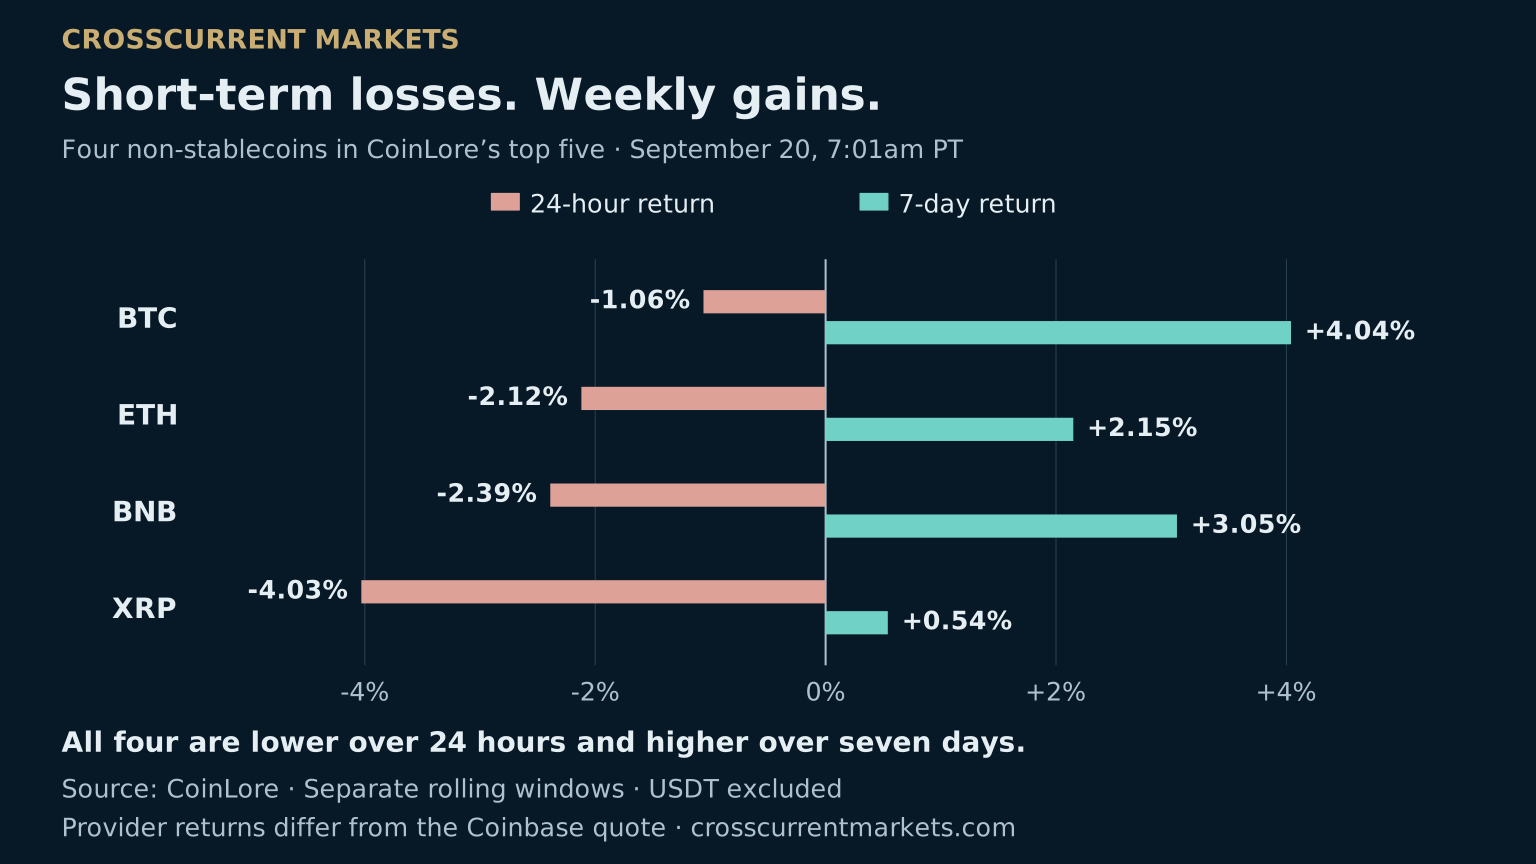
Two time horizons Daily losses, weekly gains across four major crypto assets.
Supply still growing Matched weekly stablecoin supply rises 0.290%.
Monday matters The next U.S. session tests whether ETF demand persists.
Read the full analysis and sources
Bitcoin pulled back over the last day, but that move has not erased the weekly gains in our small sample of major crypto assets. Stablecoin supply is still higher over seven days. Meanwhile, the latest U.S. ETF and Treasury observations remain Friday's readings: stronger fund inflows alongside higher yields.
Morning snapshot: Coinbase BTC/USD was $80,533.03, down 1.25% over its rolling 24-hour window, checked September 20 at 7:01am Pacific. This article preserves the morning snapshot; it is not a live price feed.
Three takeaways
- All four non-stablecoins in the provider's top-five sample were down over 24 hours but up over seven days.
- Weekly stablecoin supply growth remained positive, while one derivatives venue showed slightly higher expected volatility and lower dollar-valued open interest.
- Monday will provide the next U.S. ETF trading session. Weekend ETF data is unavailable, not zero.
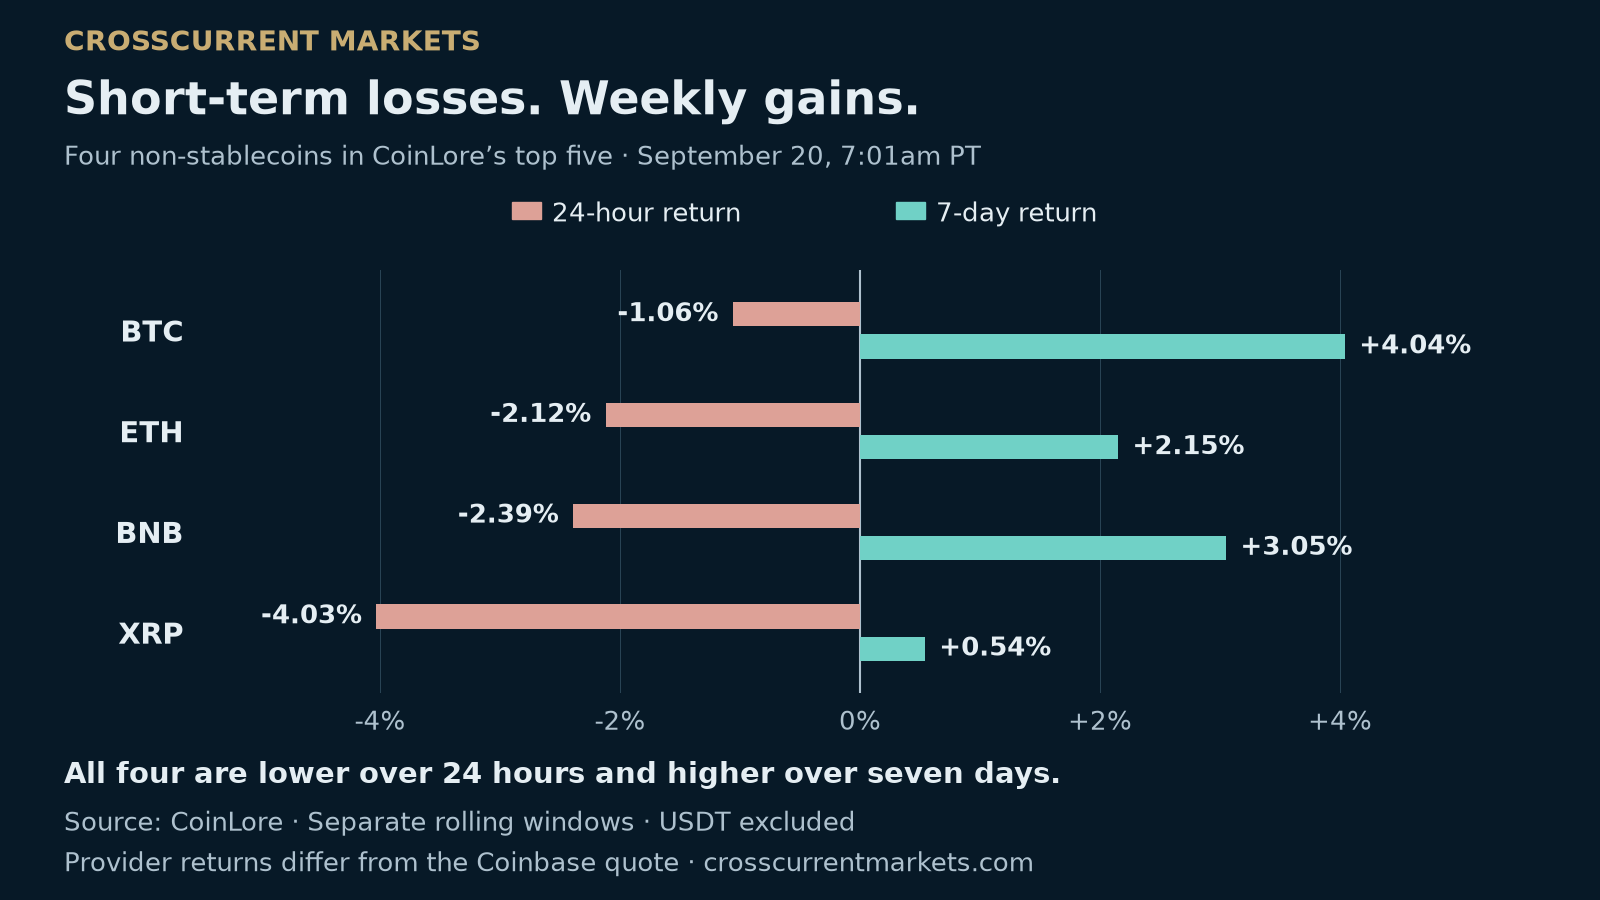
One market, two different time horizons
CoinLore's snapshot illustrates why the time window matters. Bitcoin, Ether, BNB and XRP all showed daily losses, yet all remained positive over seven days.
| Asset | Rolling 24-hour change | Rolling seven-day change |
|---|---|---|
| BTC | -1.06% | +4.04% |
| ETH | -2.12% | +2.15% |
| BNB | -2.39% | +3.05% |
| XRP | -4.03% | +0.54% |
These four assets are the non-stablecoins in CoinLore's top five; USDT is excluded. This is a deliberately small comparison, not a measure of the entire crypto market. CoinLore's BTC return differs from the opening Coinbase return because provider prices and rolling windows differ. The chart keeps all four assets on the same provider basis.
Our interpretation is that the sampled assets have given back part of their recent gains. That describes the price pattern; it does not identify a cause or establish where prices go next. A negative daily return and a positive weekly return can both be true.
Stablecoin growth does not confirm a broad liquidity contraction
DefiLlama's active USD stablecoin data showed $310.99 billion in supply at peg, with matched-assets seven-day growth of 0.290%. The previous morning's seven-day growth reading was 0.324%.
The latest weekly measure is still positive, even though it is slightly below the preceding reading. This is evidence against describing all crypto liquidity measures as contracting. It is not proof that investors are using those balances to purchase Bitcoin.
The comparison matches assets across the current and earlier observations. Its seven-day window moves each day, and membership can change. Differences between the two reported growth rates cannot be read as a single day's issuance or redemption. Supply at peg is also distinct from the tokens' market value when their prices deviate from one dollar.
Derivatives show a modest change, not a proven liquidation event
Deribit's BTC volatility index stood at 35.22 for the completed hour ending September 20 at 7am Pacific, versus 34.92 a day earlier. The increase is 0.30 index point. The incomplete next hour is excluded.
DVOL measures annualized 30-day implied volatility: the size of future price swings reflected in options pricing, not their direction. A modest increase does not tell us whether Bitcoin will rise or fall.
Dollar-valued open interest in Deribit's BTC perpetual fell from $778.08 million in the prior check to $770.97 million. Open interest measures outstanding contracts, while its dollar representation can also move with prices. These observations from one venue do not establish a marketwide liquidation event or isolate how many positions were closed.
Friday's ETF recovery needs another trading session
Farside's latest completed U.S. spot Bitcoin ETF session remained September 18, with $433.0 million in net inflows. That strong Friday left the September 14–18 total at only $6.1 million after earlier outflows. Five funds received inflows Friday, compared with one on Thursday.
This is the same dated evidence examined in our September 19 report, not new Sunday buying. The encouraging development was broader participation; the limitation was a nearly flat full week. Monday's data will help assess whether the improvement persists, once reporting is complete.
At the same time, the U.S. Treasury's ten-year nominal par yield rose seven basis points on Friday to 5.01%. Higher yields can make interest-bearing alternatives more attractive and tighten financing conditions. They are one possible influence on risk appetite, not a mechanical explanation for Sunday's price move.
Policy headlines need procedural context
Two developments earlier in the week illustrate the difference between a policy headline and a completed policy change. The Senate rejected cloture on the motion to proceed to H.R. 3633, the digital-asset market-structure bill, by 49–50 on September 15. This was a procedural vote, not a final vote passing the bill into law.
The House Financial Services Committee's September 16 record lists H.R. 8957, the American Reserve Modernization Act of 2026, as agreed to by 28–21. Committee action is a step in the legislative process. It is not enactment or evidence that the government has purchased Bitcoin. Neither vote establishes a cause for today's market movement.
Monday's checklist
The U.S. core equity session opens September 21 at 6:30am Pacific. The Federal Reserve's H.10 dollar and foreign-exchange release is due at 1:15pm Pacific. Release time and the dates of the underlying observations are different facts.
We will watch whether ETF inflows continue across multiple funds, whether Treasury yields ease, and whether matched weekly stablecoin growth stays positive. Renewed fund outflows would weaken the demand case. Continued inflows and easing yields would provide more supportive evidence, without guaranteeing a price rise.
Our current assessment is a weekend retracement within still-positive weekly returns for the sampled assets, with mixed demand and macro evidence. This is public-source analysis, not a model-generated trading signal or personalized investment advice.
Source and timing notes
The opening price and 24-hour return come from the same archived Coinbase response. The chart uses a separate, explicitly named provider. Crypto prices trade through the weekend; U.S. ETF observations await regular sessions. Linked provider pages can change after publication. All values here retain their stated observation windows.
Archived report · September 20, 2026. Values retain their original dates.