
Historical report · observations from September 18, 2026
Demand improved ETF inflows returned but were concentrated in one fund.
Possible accelerator Reported short liquidations may have amplified the advance.
Trigger unresolved The evidence does not attribute the full 24-hour gain.
Read the full analysis and sources
Bitcoin's sharp rise has a clearer demand backdrop than the previous session, but no single verified explanation accounts for the entire move. U.S. spot Bitcoin ETFs returned to net inflows. Later reporting described substantial forced closures of bearish crypto positions. Those are distinct pieces of evidence: one describes a daily investment channel; the other describes a possible accelerator during the rally.
Morning snapshot: Coinbase BTC/USD was $80,286.99, up 5.06% over its rolling 24-hour window, when checked September 18 at 7:01am Pacific. This is an archived observation, not a live quote. The liquidation report discussed below refers to a later reported market observation; it does not isolate what caused the full gain already visible at our check.
The evidence at a glance
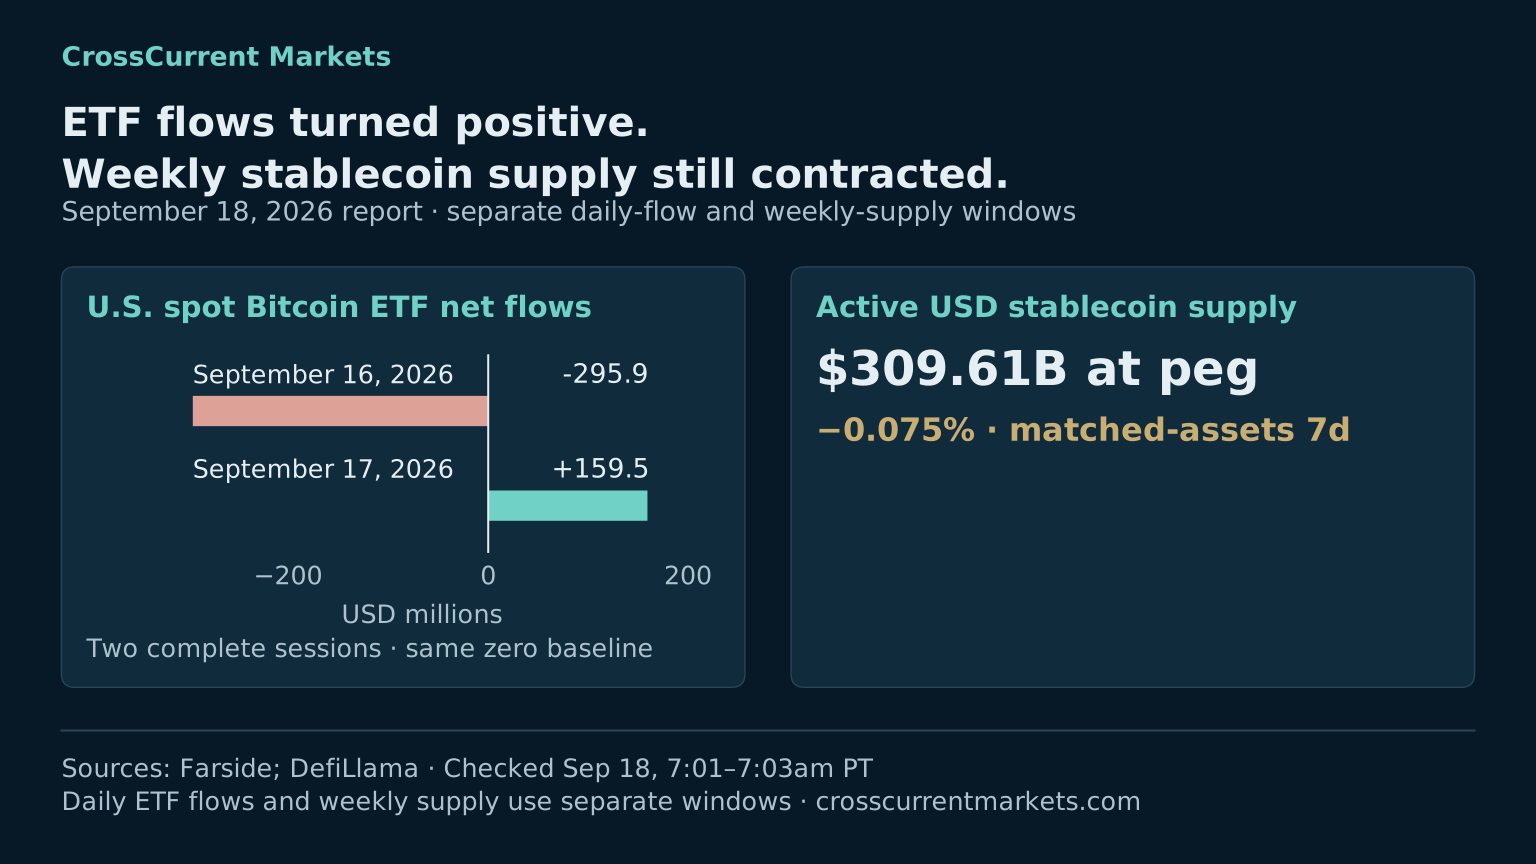
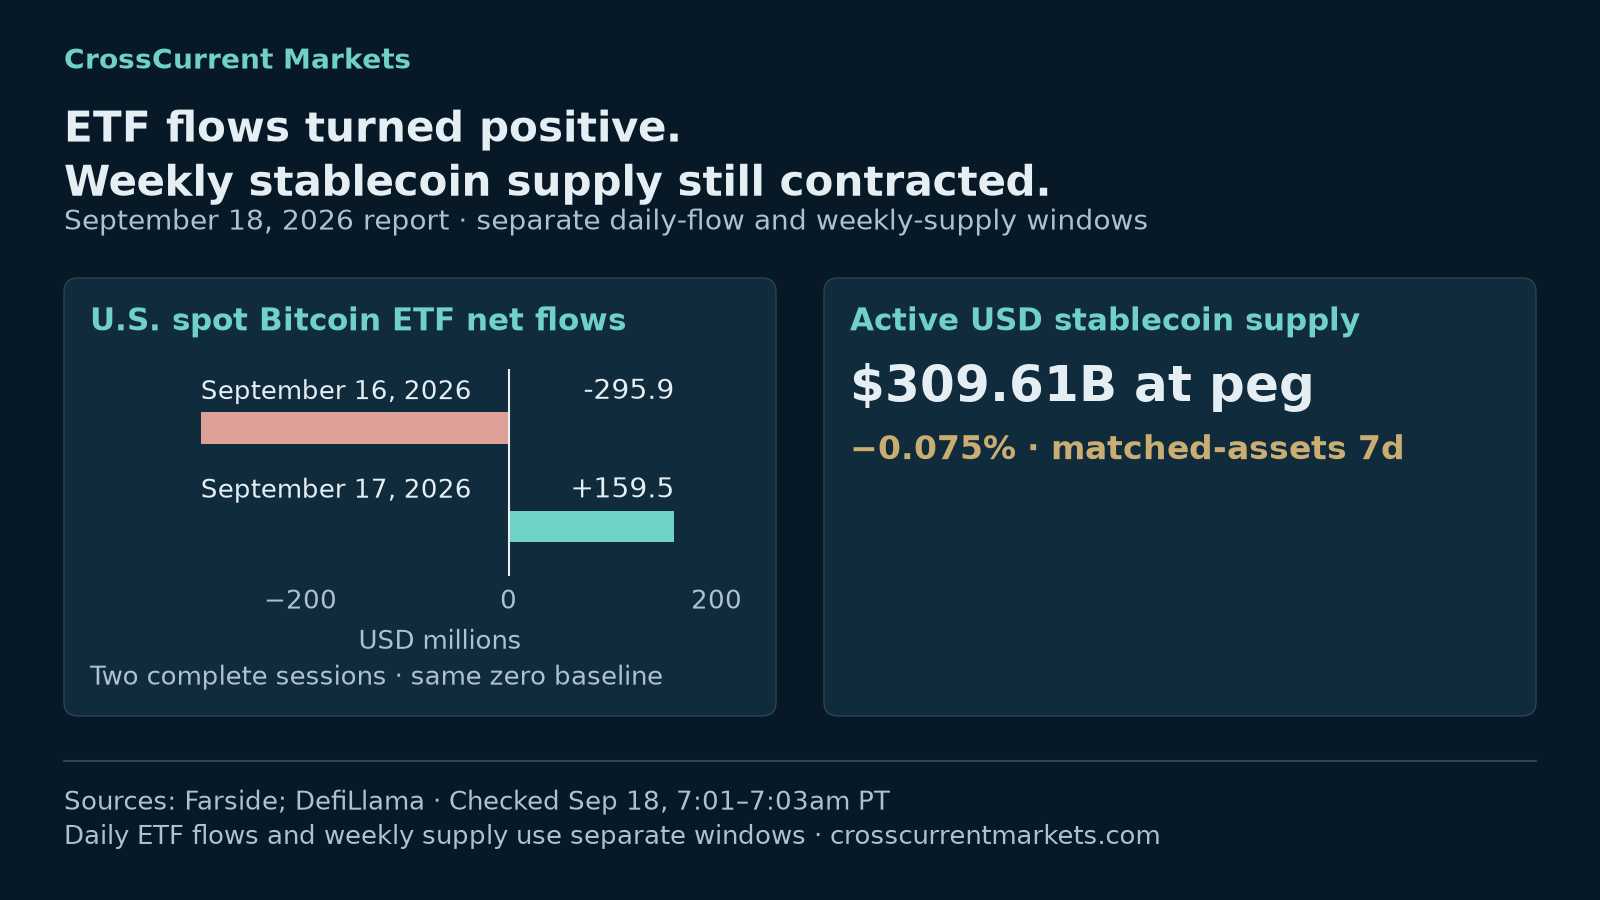
- ETF demand improved: Thursday's $159.5 million net inflow followed Wednesday's $295.9 million outflow.
- Short covering may have amplified the move: a secondary report described roughly $183 million in crypto-wide short liquidations within an hour.
- Confirmation remains incomplete: the initial trigger is unresolved, stablecoin supply edged lower over seven days, and one exchange's rolling trading volume was lower than in our prior morning check.
What changed in ETF demand
Farside's U.S. spot Bitcoin ETF table recorded $159.5 million in net inflows for September 17, compared with $295.9 million in net outflows on September 16. The positive day matters because a monitored channel of investment demand improved.
The composition matters too. IBIT received $183.7 million, while the other funds together recorded a net $24.2 million outflow. This was concentrated buying, rather than a uniformly positive result across funds. A single positive session is encouraging evidence, not proof of a persistent trend.
These are completed daily totals. They cannot tell us which transaction started an intraday price move, or establish how much of Bitcoin's 24-hour return was caused by ETF activity. Their role is to describe the demand backdrop.
How short covering can accelerate a rally
A trader who is short is positioned to benefit from a falling price. Closing a conventional short requires buying back the exposure. For leveraged derivatives, forced position closures can create upward pressure through the trading and hedging process; this is not necessarily a dollar-for-dollar purchase of spot Bitcoin.
If prices rise enough, some positions hit their liquidation thresholds. Forced closures can push prices higher and put other shorts under pressure. Think of an initial move triggering a chain of exits. The chain can amplify a rally without identifying what started it.
Bitcoin.com reported approximately $183 million in crypto-wide short liquidations within an hour around a move toward $81,000 at about 7:45am Pacific. We have not independently verified that liquidation total. It covers crypto broadly, not Bitcoin alone, and its hourly window may overlap the earlier snapshot.
That supports short covering as a possible amplifier. It does not establish that liquidations explain the full 5.06% rolling return, nor how much genuine new spot demand accompanied them. A liquidation total is not a measure of net new investment capital.
The macro backdrop changed across sessions
Thursday's stock rally coincided with lower oil prices and Treasury yields, according to Associated Press market coverage. That provided a more supportive setting for risk-taking. It is context, not a measured causal explanation of Bitcoin's move.
By Friday morning, Schwab's market update described Treasury yields and the dollar moving higher again. It would therefore be misleading to attribute Friday's Bitcoin advance simply to continuously falling yields or a weakening dollar.
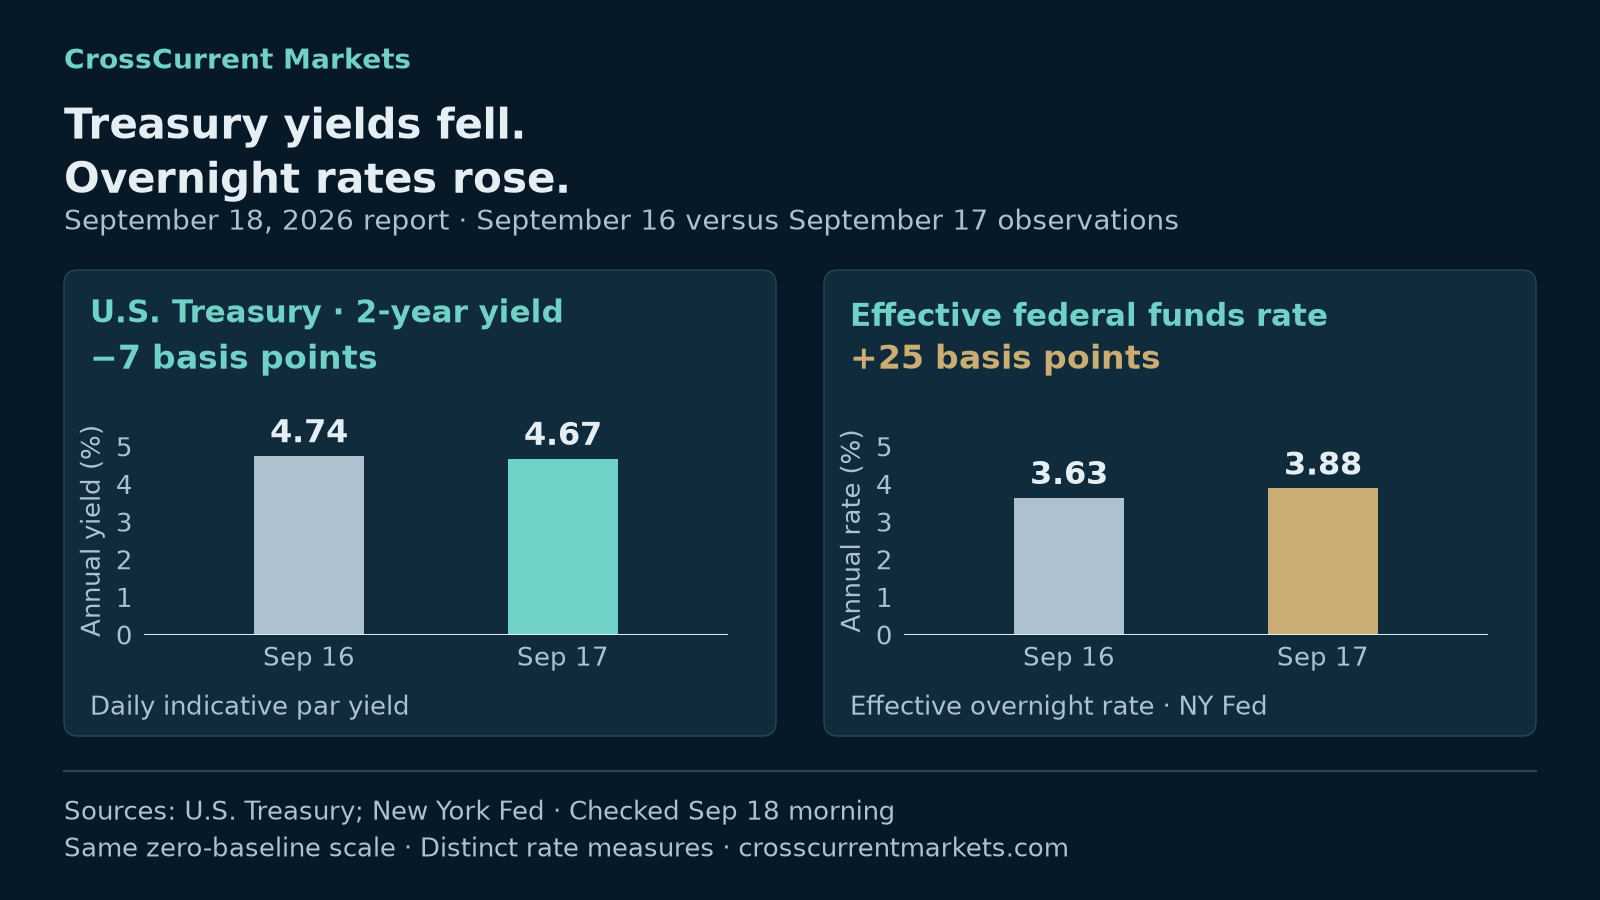
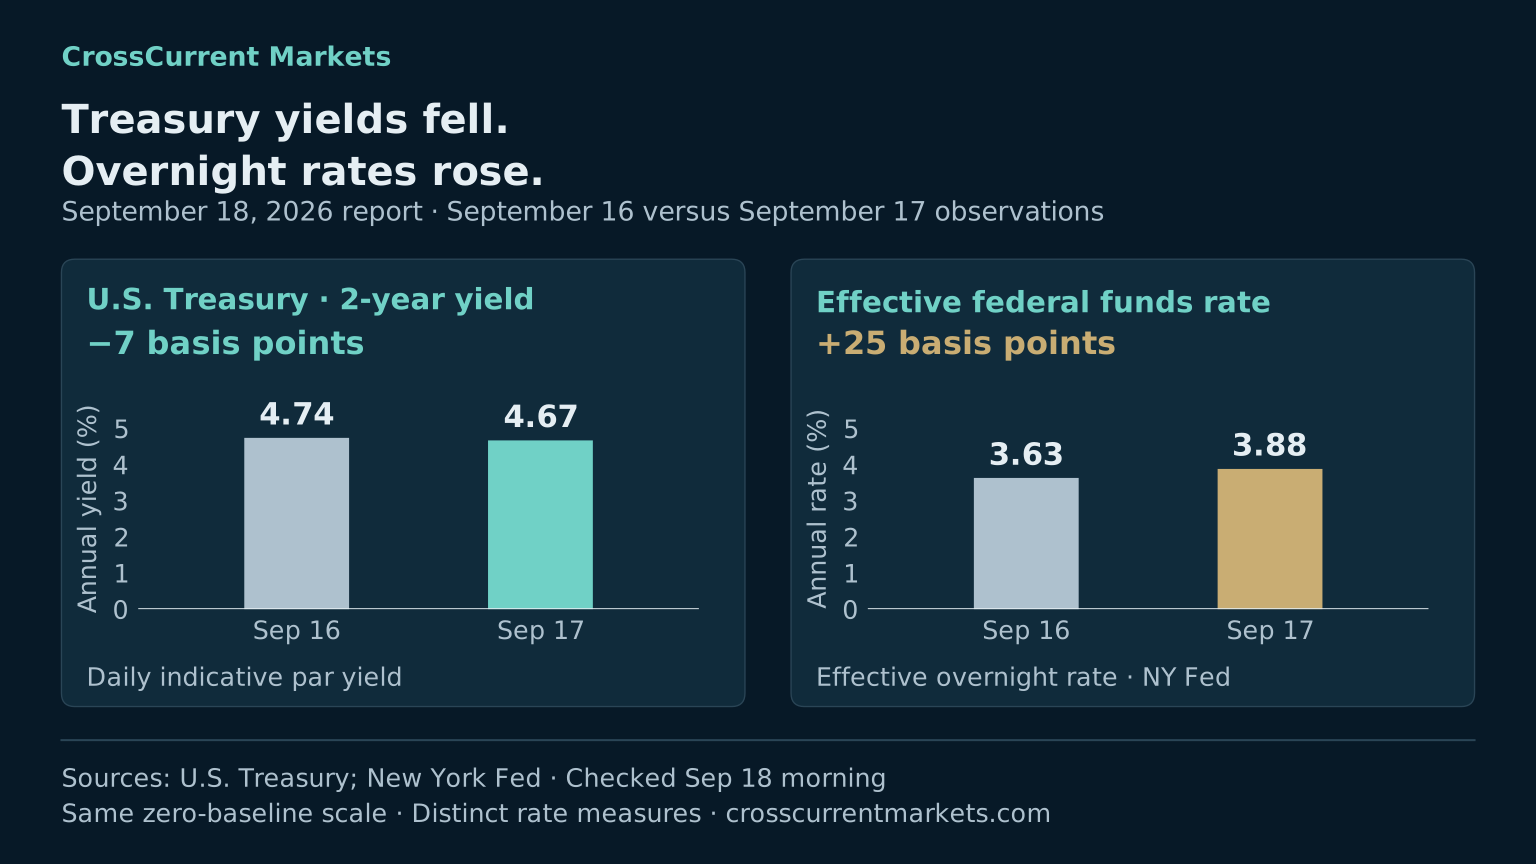
The dated rate chart also separates two different clocks. Treasury market yields fell between the September 16 and 17 observations, while published overnight rates rose as the new Fed policy range took effect. A market yield and an overnight funding rate are different measures; neither is a live reading in this report.
What the rally does not yet prove
DefiLlama's stablecoin data showed about $309.61 billion in active USD stablecoin supply at peg, with a matched-assets seven-day change of -0.075%. That small contraction does not confirm a broad increase in this particular pool of crypto liquidity. Stablecoin supply is not the same thing as capital actively buying Bitcoin: existing balances can change hands without new tokens being issued.
Coinbase's rolling BTC trading volume was about 6,538 BTC, roughly 8% below the 7,103 BTC observed in our prior morning check. These are two rolling windows on one venue. Volume includes transactions in both directions; it is not a buy-flow measure. Lower rolling volume cannot rule out a concentrated intraday burst or activity elsewhere.
We also lack a verified, synchronized intraday series combining market-wide spot flows, liquidations and open interest. Without that, assigning a precise share of the rally to each driver would create false precision.
What would strengthen the recovery case
The next useful question is whether buying persists after forced closures ease. Repeated positive ETF sessions, inflows distributed across more funds, and independently verified evidence of sustained spot demand would strengthen the case. Continued price gains alone would not distinguish those mechanisms.
Our assessment: ETF demand improved, and reported short liquidations offer a plausible amplification mechanism. The initial trigger remains unconfirmed. This is independent public-source market context, not a model-generated trading signal or a recommendation to buy or sell.
Data and reading notes
The opening price and rolling return come from the same archived Coinbase product-statistics response. Visuals retain their September 18 morning checks and stated observation dates. Daily ETF totals, rolling price returns, hourly liquidation reporting and seven-day supply changes should not be added together or treated as a single measurement window. Linked provider pages may update after publication.
For additional context, read our September 17 report and why lower volatility does not establish stronger demand.
Archived report · September 18, 2026. Values retain their original dates.