
Historical report · observations from September 17, 2026
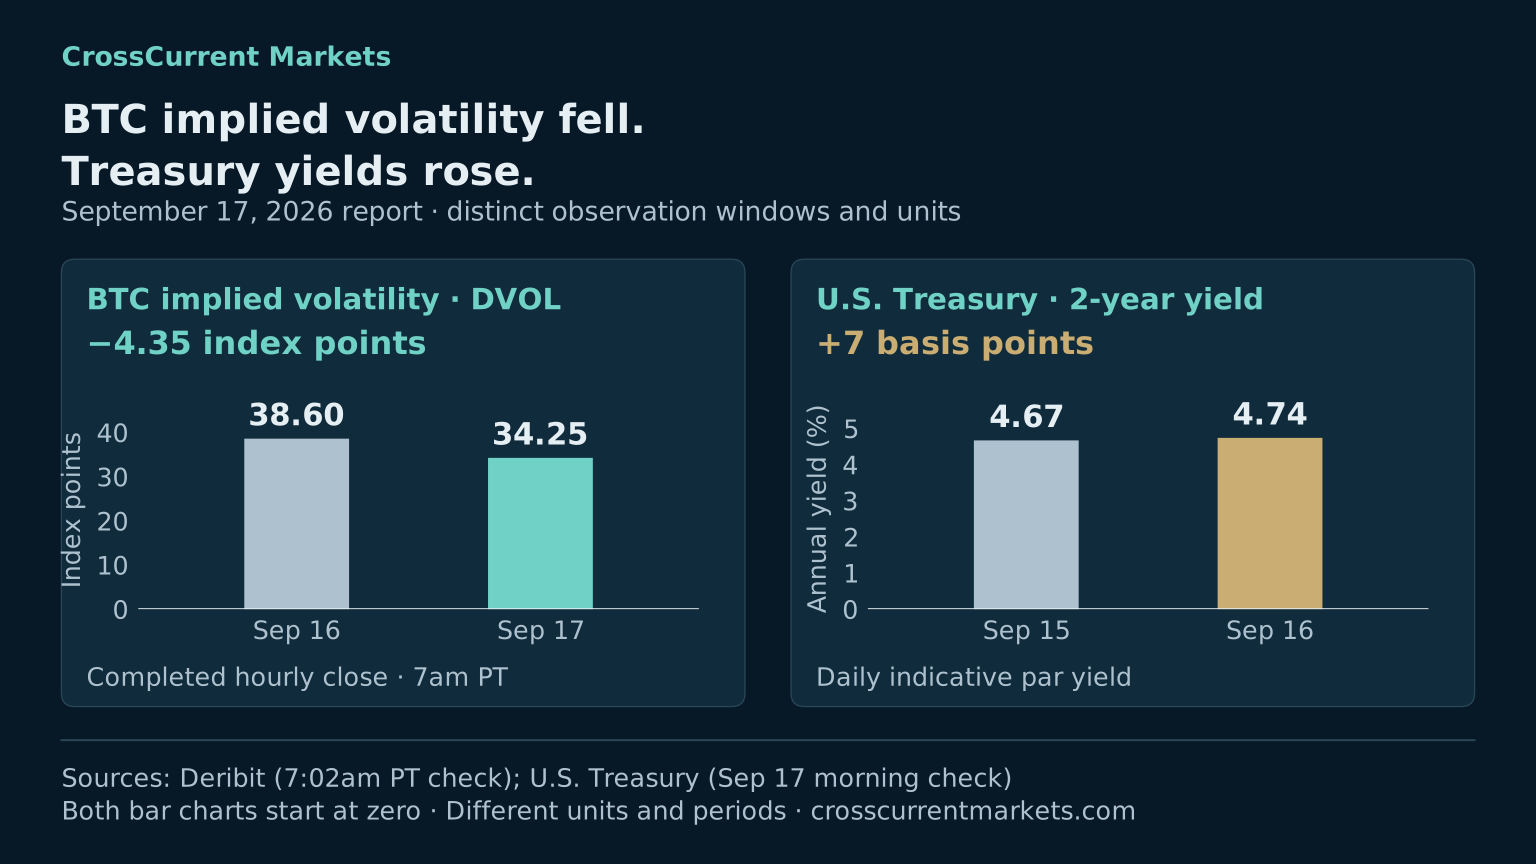
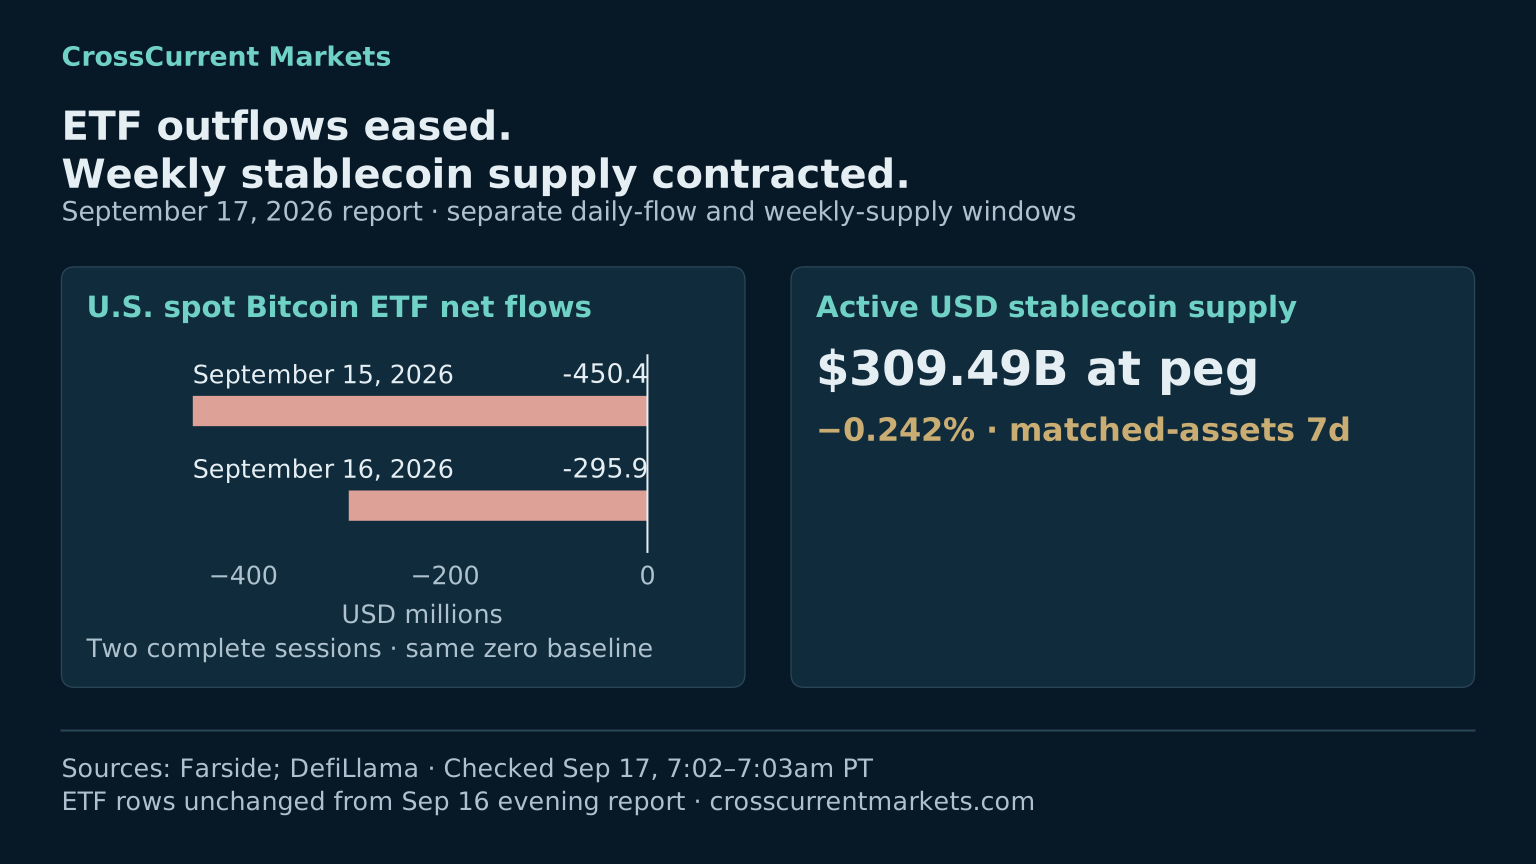
What changed BTC volatility cooled; Treasury yields rose and the higher Fed range took effect.
Why BTC Price resilience still lacks broad confirmation from ETF flows and stablecoin supply.
What to watch New funding observations, the next complete ETF session and scheduled macro releases.
Read the full analysis and sources
Bitcoin was $76,521.36, up 1.17% over the preceding 24 hours, at our September 17, 7:02am Pacific check. Options-implied volatility fell, but Treasury yields rose and the latest completed ETF sessions remained negative. Our read: price resilience still lacks broad confirmation from measured fund demand and stablecoin supply. Coinbase
This article preserves the morning research cutoff. Prices, reporting completeness and scheduled-event status below describe that check, rather than conditions at the moment you read the article.
What changed since the evening report
The Fed's higher 3.75–4.00% target range takes effect September 17. The increase was already known in our September 16 evening report. The new information in this morning's research includes Treasury's September 16 yield observations, a lower completed-hour volatility reading, and fresh labor and housing releases. Fed implementation note
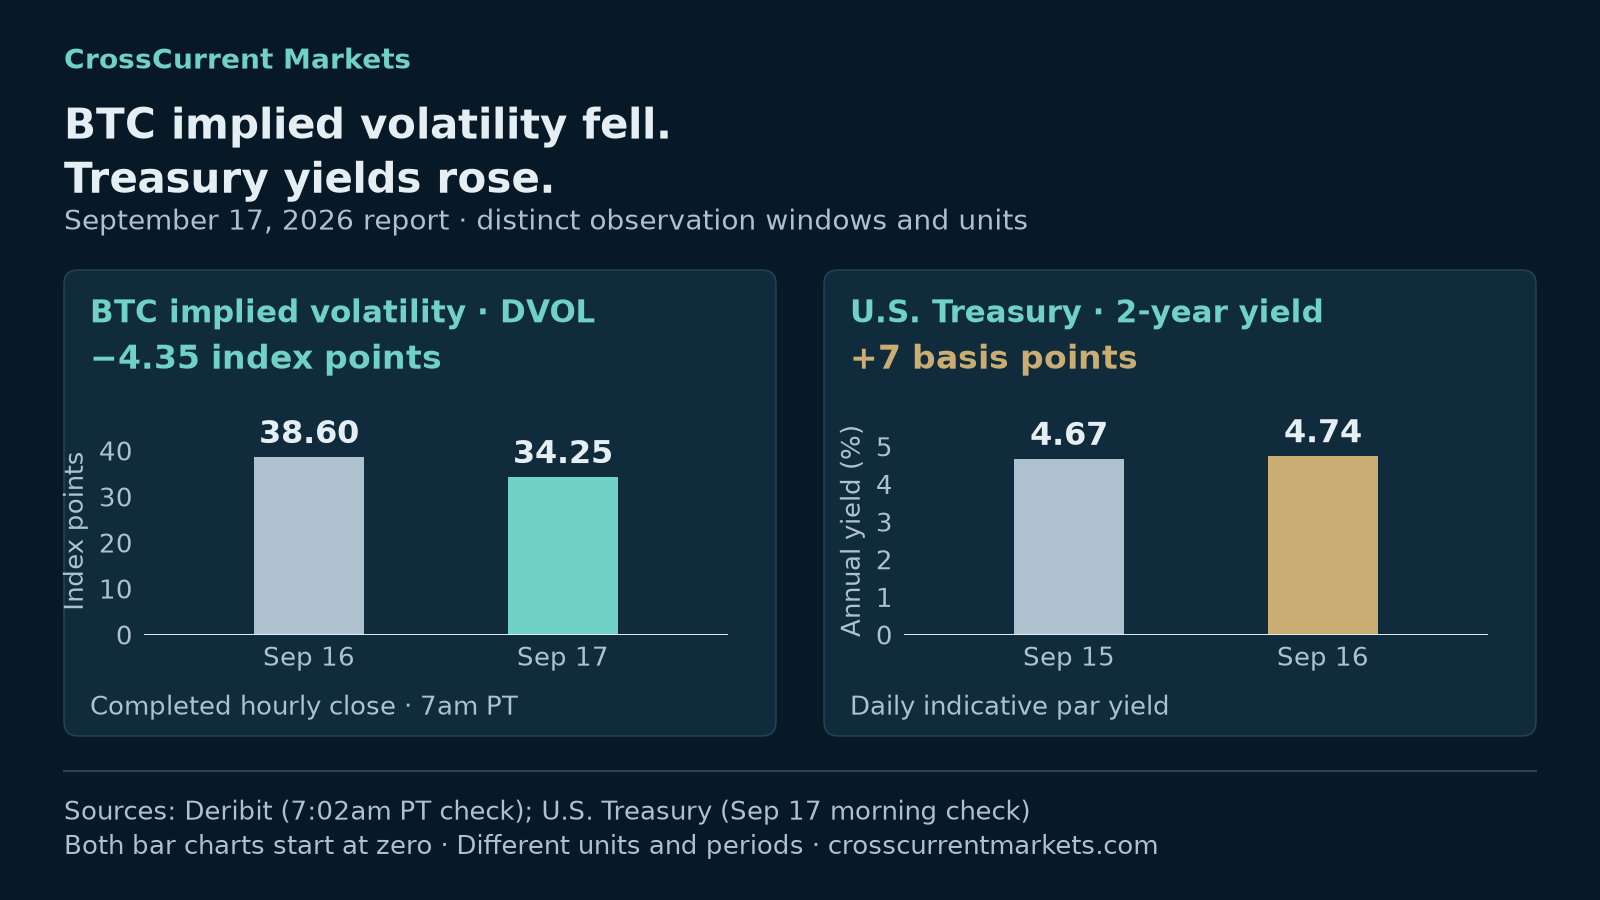
Treasury's two-year nominal par yield increased from 4.67% on September 15 to 4.74% on September 16, a rise of seven basis points. The ten-year increased from 5.00% to 5.01%, one basis point. These are dated indicative yields, not live September 17 quotes. The daily change cannot isolate the effect of the Fed announcement from other developments. Treasury daily yield curve
Higher yields can make interest-paying alternatives more attractive and affect financing conditions. Their effect on Bitcoin is neither immediate nor mechanical. A positive BTC return alongside higher yields is a reason to examine the competing forces, rather than assume every asset must react identically.
Lower volatility is useful counterevidence
Deribit's BTC DVOL closed at 34.25 for the hour ending September 17 at 7am PT, versus 38.60 at the corresponding September 16 close. That is a decline of 4.35 index points. The still-forming next hour was excluded. Deribit hourly data
DVOL measures 30-day annualized implied volatility. A lower reading indicates less option-implied movement; it does not predict the direction of the next move or establish that event risk has disappeared. The positive rolling BTC return and lower DVOL challenge a uniformly negative reading, but neither establishes that new institutional demand has arrived.
ETF demand and stablecoin supply remain soft
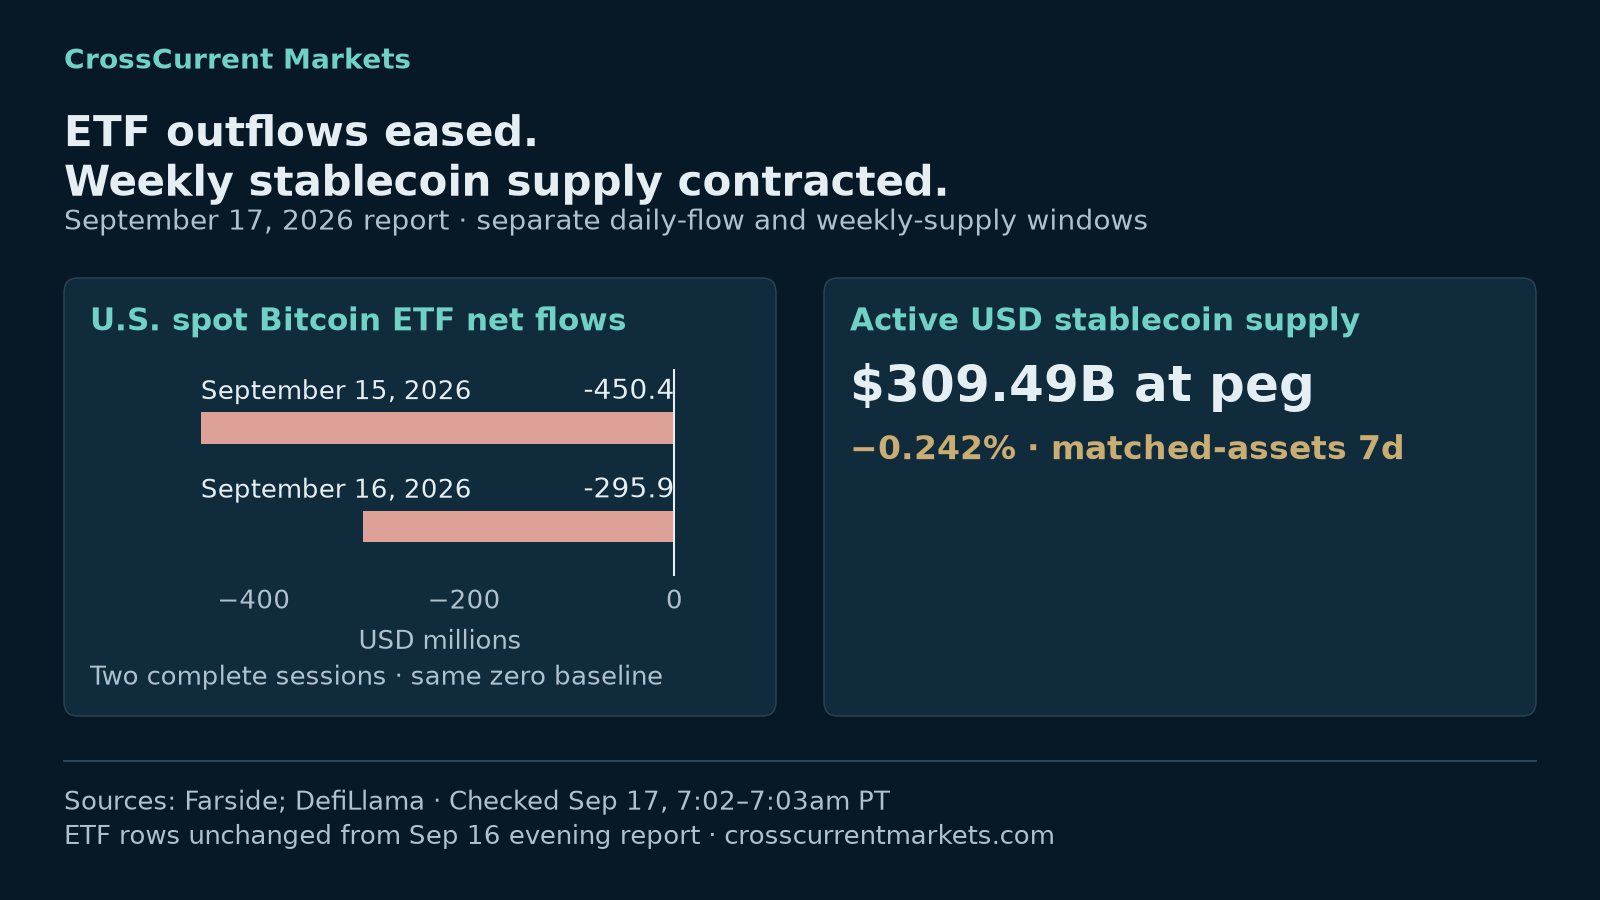
The latest completed U.S. spot Bitcoin ETF sessions were September 15 and 16: net outflows of $450.4M and $295.9M, respectively. Together they total $746.3M. Wednesday's outflow was smaller, but still negative. These are the same completed sessions covered in last night's report; Thursday's session was unreported at the morning cutoff. A blank fund entry is not a zero flow. Farside
Active USD stablecoin supply was $309.49B at peg. Its seven-day change was −0.242% using the same assets with available history. The comparison matched 308 of 314 active assets, covering approximately 99.979% of current supply. This is a small weekly contraction, not evidence of broad supply expansion. DefiLlama
ETF flows measure one investment channel. Stablecoins measure outstanding balances that can be used for several purposes, not just buying Bitcoin. The figures use different windows and must not be added together. Changes between morning and evening stablecoin totals are also not a clean measure of intraday issuance because the universe and rolling history can change.
Labor and housing point in different directions
The September 17 releases at 5:30am PT added two different signals. Seasonally adjusted initial unemployment claims fell to 196,000 for the week ended September 12, from 206,000. That suggests fewer new claims in this particular weekly measure; it is not a direct count of total unemployment or payroll growth. Department of Labor
August housing permits declined 2.7% from revised July, to a seasonally adjusted annual rate of 1.394 million. Annualized rates describe a pace, not the number of permits issued during one month. Housing starts were estimated to fall 2.6%, but the reported 90% confidence interval included zero, so the direction of that change was not statistically clear. Census residential construction release
The combination supports a mixed growth assessment. It does not justify assuming either an imminent recession or an economy uniformly accelerating. Both reference periods precede the September Fed decision.
Funding data need their own dates
| Observation | Value | Timing limit |
|---|---|---|
| Fed target range | 3.75–4.00% | Effective September 17; an announced policy setting. |
| Effective federal funds rate | 3.63% | September 16 observation; predates the new setting. |
| SOFR | 3.62% | September 16 observation, down 2bp from September 15. |
| Overnight reverse repo accepted | $5.375B | September 16 operation closed before the Fed announcement. |
The latest published overnight rates at the cutoff described September 16. They therefore could not test implementation of September 17's higher range. Likewise, the reverse-repo operation cannot be characterized as a reaction to an announcement that happened afterward. New York Fed rates, reverse-repo results
What would change our assessment
Sustained completed-session ETF inflows, expanding matched stablecoin supply and easier financing conditions would strengthen the demand case. Persistent outflows and elevated financing costs would strengthen the headwind case. Lower volatility alone would not settle that question.
At the morning cutoff, the next scheduled U.S. checks were the Fed balance-sheet release on September 17 at 1:30pm PT and industrial production on September 18 at 6:15am PT. The Bank of Japan's September 17–18 meeting was also underway in Japan's local calendar; no outcome was assumed. Fed calendar, H.4.1, BOJ calendar
This assessment is qualitative public-source research, not a model-generated forecast or a price target. For the distinction behind the opening chart, read Why lower Bitcoin volatility does not mean stronger demand.
Archived report · September 17, 2026. Values retain their original dates.